Weekly Market Outlook - Despite the Dip, The Recovery Remains Intact
The market ended last week in the red. But, the loss was small... small enough to not sweat. None of the indices lost enough ground to say they'd reversed course from the rebound rally put into motion six weeks ago. In fact, in some ways the recovery move was confirmed despite the dip... a slight ebb that could have been expected anyway. We are, after all, on the verge of testing some major resistance levels. The bulls are better served by starting the breakout thrust by establishing a base first.
We'll look at the idea in detail below. First though, let's look at last week's plethora of economic reports, which were a mixed bag.
Economic Data Analysis
We got a lot last week. Let's just take it in order of appearance, beginning with the look at last month's producer inflation figures to round out the prior week's consumer inflation report. As was the case for consumers, producers, factories, and assemblers saw their costs cool slightly in October, but only slightly. The overall producer inflation rate now stands 8.0%, and 5.4% on a core (ex-food and ex-energy) basis.
Inflation Rate (Annualized) Charts
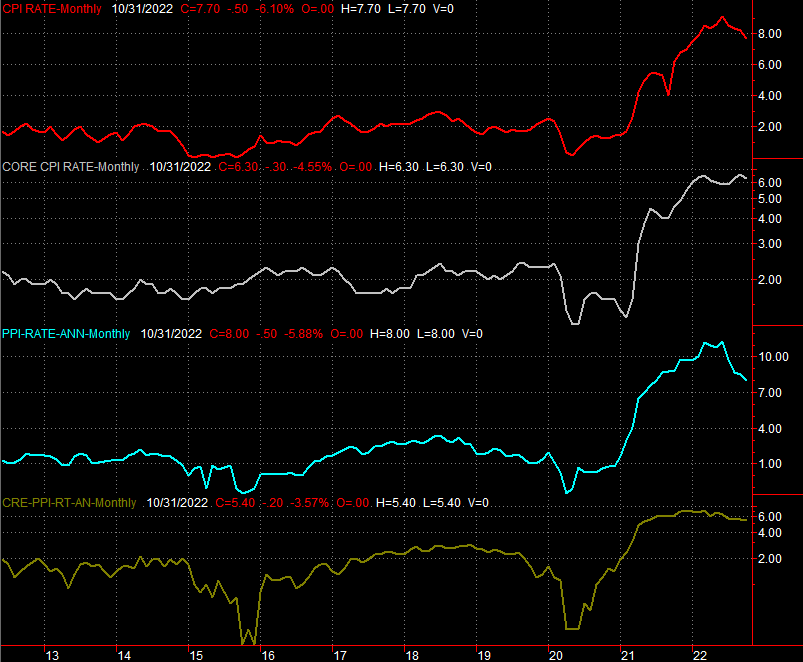
Source: Institute of Supply Management, TradeStation
This measured progress is a key reason stocks surged two weeks back, and certainly the same cooling inflation report for the nation's producers offered added assurance that things are final cooling off in this regard. Still, both inflation rates are abnormally high. We need a lot more progress a lot faster if we want to stave off economic weakness.
On Wednesday we got last month's capacity utilization and industrial productivity figures. They were... just ok. Production was flat, falling short of the expected 0.4% growth and capacity utilization of 80.3% was in line with expectations as well as even with the prior month's number.
Capacity Utilization and Industrial Productivity Charts

Source: Federal Reserve, TradeStation
This is encouraging, as these numbers tend to correlate most closely with corporate earnings as well as the market's long-term trend.
In the same vein, last month's retail sales data was solid... a much-needed win following September's decided swoon. With or without automobiles factored in, retail spending grew 1.3% in October.
Retail Sales Charts
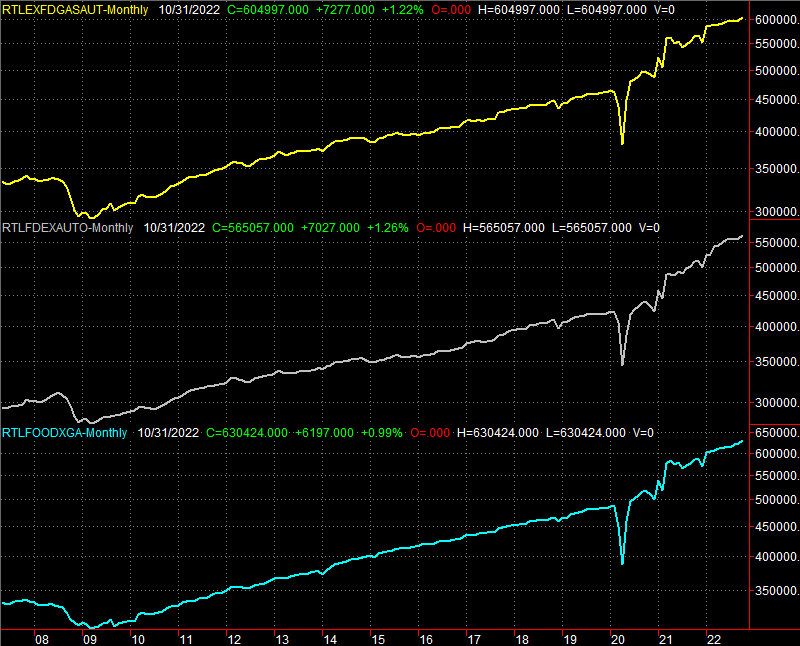
Source: Census Bureau, TradeStation
It's still too soon to call it a smashing success, since at least some of this increase can be chalked up to higher prices. Consumers aren't completely balking when it comes to shopping though, indicating a certain degree of tailwind.
Building permits improved a little last month, and housing starts fell a bit. However, both were more or less in line with September's figures, which are anything but good.
Housing Starts and Building Permits Charts
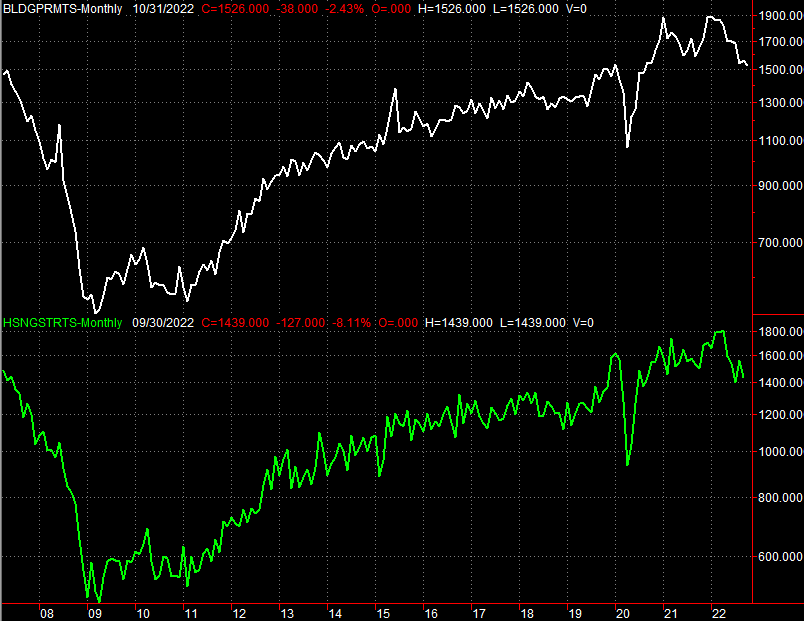
Source: Census Bureau, TradeStation
Economic Calendar
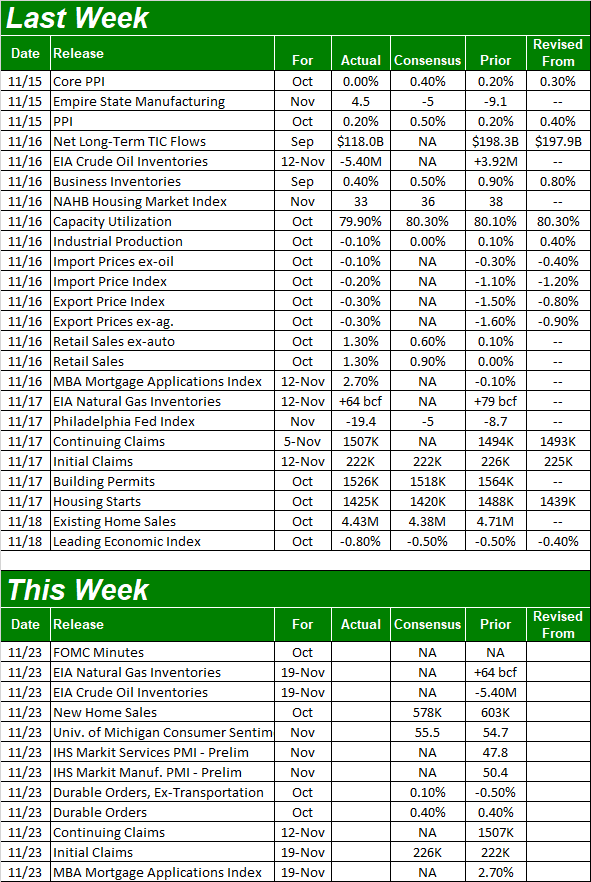
Source: Briefing.com
There's not a lot in the lineup for this holiday-shortened week, but there are a few items worth watching heading into the weekend and then next week, out of the month.
The first of these will be the release of the minutes from the most recent meeting of the Federal Reserve's governors, due on Wednesday. It's not a scheduled time to change (raise) interest rates, and though it can, the FOMC probably won't do. Nevertheless, be alert for any changes to the language the committee chooses to use. The recent rate hikes are working, and may be working faster than expected.
Also on Wednesday we'll het last months new home sales number, rounding out last week's look at existing home sales. Sales of existing homes fell for a ninth straight month in October, and new home sales are apt to keep moving in the same downward direction.
Home Sales Chart Charts
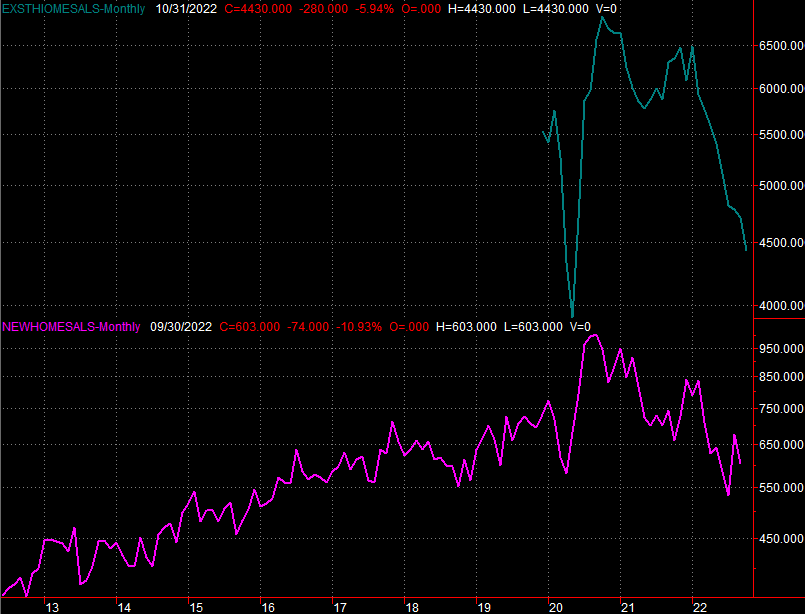
Source: National Association of Realtors, Census Bureau, TradeStation
Finally (and again on Wednesday), look for the third and final update of the of monthly University of Michigan Consumer Sentiment reading. The figure is projected to be down quite a bit.
Consumer Sentiment Charts

Source: University of Michigan, The Conference Board, TradeStation
The Conference Board's measure of consumer sentiment isn't coming out until next week, so no outlooks are available yet. Broadly speaking though, it's saying the average person isn't completely stoked about the current condition of things, even if they are spending money.
Stock Market Index Analysis
We kick this week's analysis off with a zoomed-in look at the daily chart of the NASDAQ Composite, since that tells most of all we need to know. Simply put, the index -- and the market -- are trapped between a rock and a hard place. The composite was unable to move above its 100-day moving average line (gray), but is also holding above its now-converging 20-day (blue) and 50-day (purple) moving averages. One boundary or the other will have to buckle sooner or later. When that happens we'll have a much better idea of which direction stocks really want to move.
NASDAQ Composite Daily Chart, with VXN

Source: TradeNavigator
The daily chart of the S&P 500 is telling us a similar (but not identical) story. The S&P 500 hurdled its 100-day moving average line (gray) a couple weeks back, and even seems to have found support at this line late last week. It's still trading below its 200-day line (green) at 4067 though, and it's still below its straight-line resistance that connects all the key highs going back to January. This ceiling will need to be broken to really entertain bullishness here.
S&P 500 Daily Chart, with VIX and Volume
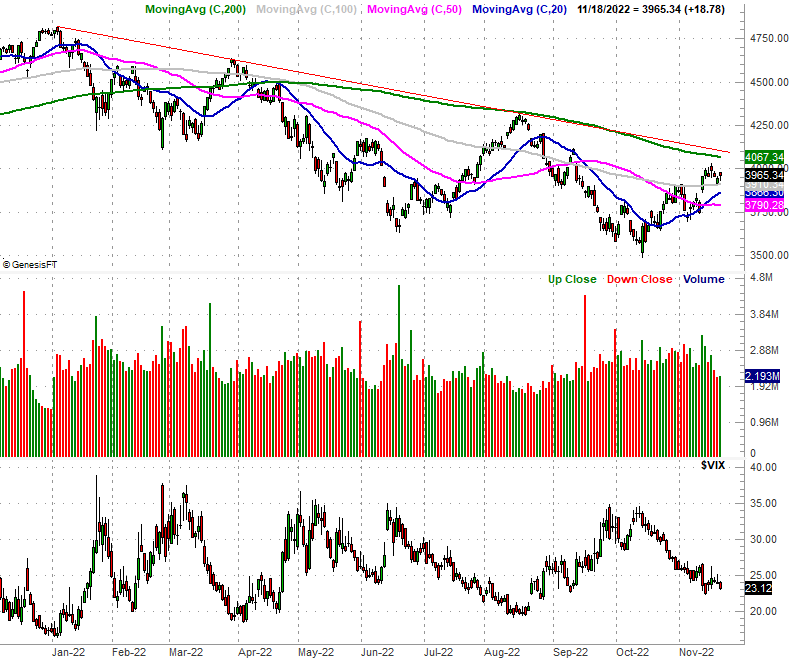
Source: TradeNavigator
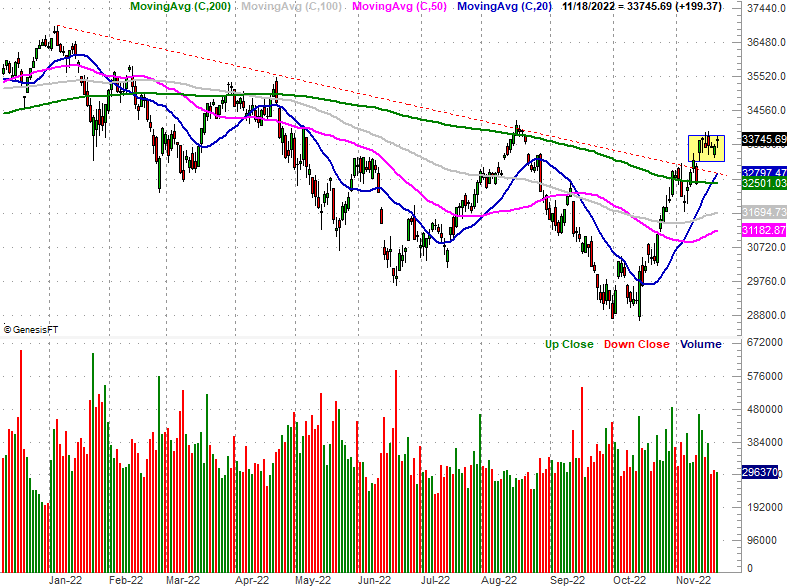
As for the Dow Jones Industrial Average, it's made more and better progress than the NASDAQ or the S&P 500... perhaps indicative of flight to the safety of blue chips. Namely, the Dow's blasted past its 200-day moving average line (green) as well as a long-standing technical ceiling (red dashed).
Dow Jones Industrial Average Daily Chart, with Volume
Source: TradeNavigator
Even so, the shape and placement of the last few daily bars means the Dow's not quite out of the woods yet. The highlighted area on the daily chart of the Dow Jones Industrial Average chart above? It's going to have to break out of that box first. The thing is, the longer that trading range remains in place, the tougher it is to push out of, although any break from it is more explosive the longer it takes to break free; think of it as a slingshot. That upper edge is right around 34,000.
To really get a grip on where things stand, however, we have to take a step back and look at the weekly charts. This vantage point gives us a great deal more perspective.
The weekly chart of the S&P 500 doesn't tell us a whole lot more we don't know about the index's ceiling and floors. But, it does show us how the volatility index (or VIX) is nearing a major floor around 21. If history repeats itself, the S&P 500 will log at least a short-term high if-and-when the VIX falls to that mark. Of course, the VIX could easily reach that level right around the time the S&P 500 is testing the aforementioned ceilings near 4090.
S&P 500 Weekly Chart, with VIX and Volume
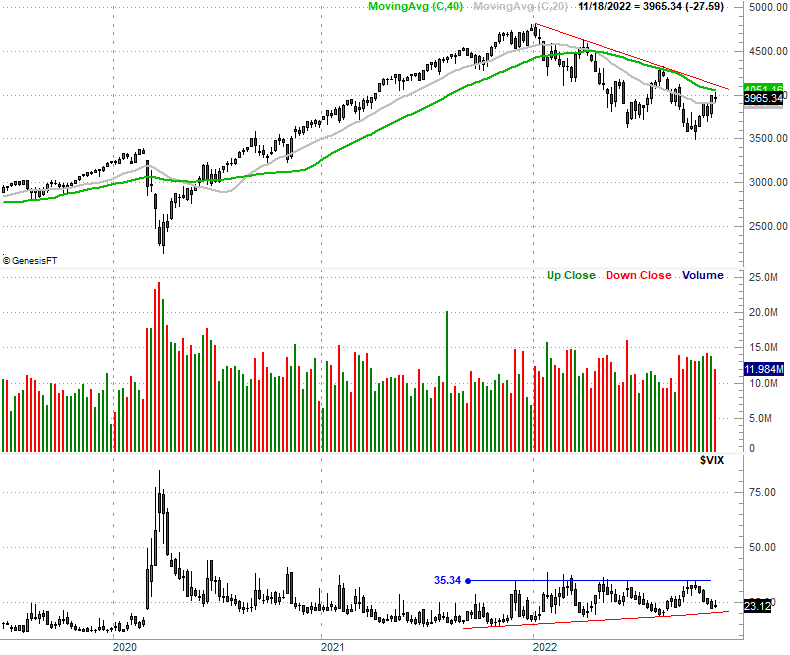
Source: TradeNavigator
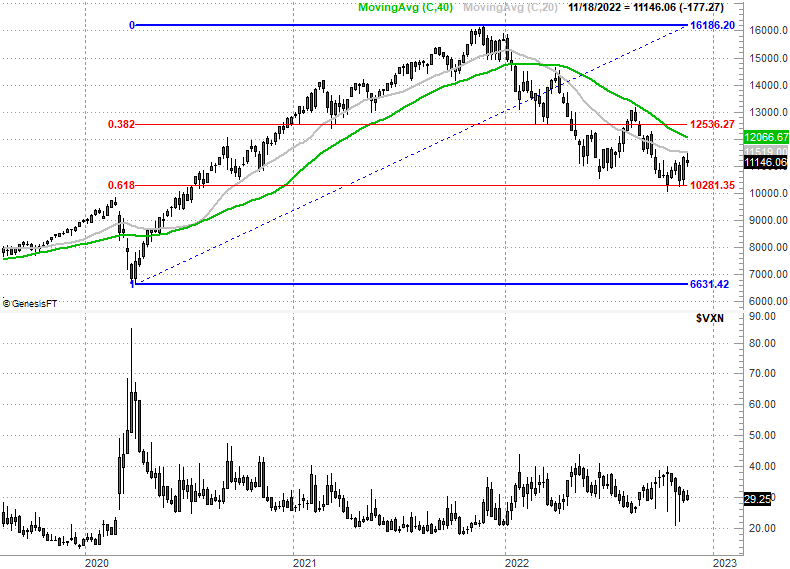
The only thing to add of the weekly chart of the NASDAQ Composite is, note how the 61.8% Fibonacci retracement line at 10,28 is still well intact as a support level. Even any renewed bearishness will have to contend with that floor.
NASDAQ Composite Weekly Chart, with VXN
Source: TradeNavigator
In short, the market actually needs a little volatility here to break it out of its rut. Just don't look for that volatility this week. Exchanges are closed on Thursday, but given the holiday, many people treat it like a four-day weekend if they don't take the entire week off. The next few days are likely to be rather mild, low volume ones even with all the economic news due on Wednesday.