Weekly Market Outlook - Despite the Calendar, The Momentum is Bullish... and Well-Supported
Another week, another win. As was the case with the previous week's gain, however, last week's advance was minimal. Maybe it's the summer lull. Maybe traders are simply unconvinced that companies justify higher prices with their current valuations. Maybe it's a little both.
Either way, last week's small win was bigger than the S&P 500's 0.6% gain would imply. That's because all the indices found support where they truly needed to, and have no technical resistance immediately above. There's still good reason to fear more gains will be difficult to log from here. But, that prospect is certainly not ruled out.
We'll take a look at the tug-of-war below, as always. First, let's recap last week's economic reports and look at what's coming this week. The biggie, of course, is last month's not-completely-thrilling jobs report.
Economic Data Analysis
There's no sense in beating around the bush - last week's jobs report for May was a mixed bag. The unemployment rate fell from 6.1% to 5.8%, coming in even better than the 5.9% economists were modeling, Payroll growth of 559,000, however, fell short of the modeled 720,000. Most of the progress the unemployment rate made was the result of people dropping out of the labor force. The labor force participation rate slipped from 61.7% to 61.6%, shrinking the number of people capable of being technically unemployed.
Payroll Growth and Unemployment Rate Charts
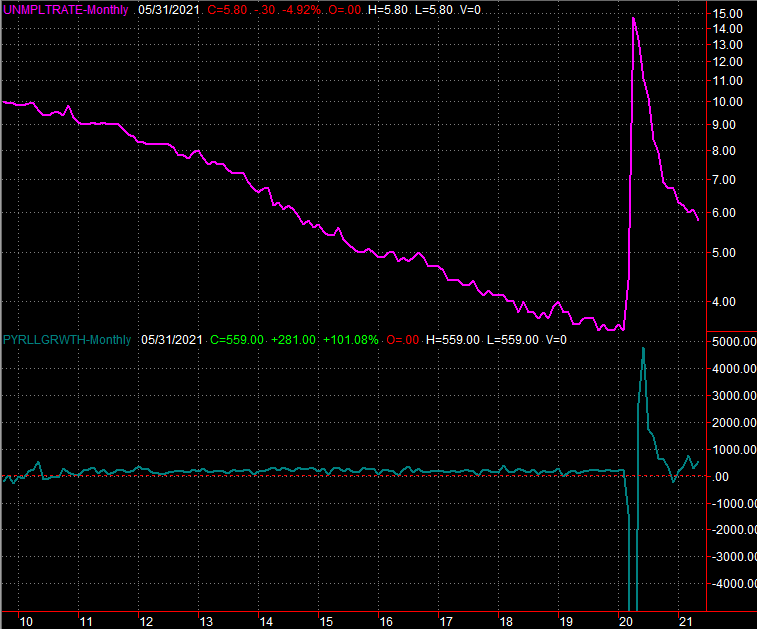
Source: Department of Labor, TradeStation
Still, we're making much-needed progress.
That progress is evident in other ways too, like the Institute of Supply Management's measure of strength, on the manufacturing as well as the services fronts. The ISM services index ramped-up from 62.7% to 64.0%, surpassing the forecast for 63.0%. The manufacturing index came on at 61.2% for May, versus April's reading of 60.7%, leapfrogging calls for 63.0%.
ISM Services and Manufacturing Index Charts

Source: Institute of Supply Management, TradeStation
Any reading from either measure suggests a positive economic environment. These reading are deep into growth territory.
Everything else is on the grid.
Economic Report Calendar
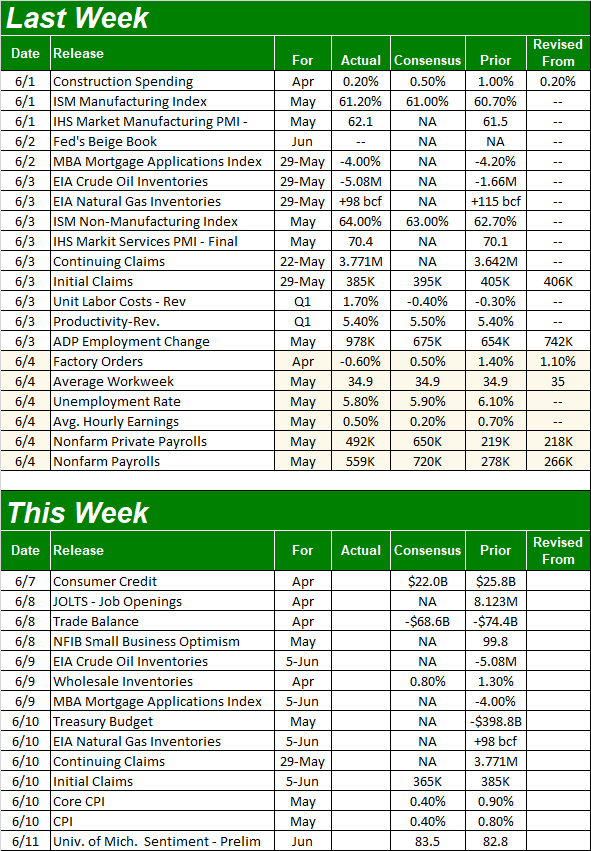
Source: Briefing.com
This week isn't going to be a terribly busy one, but we're kicking off a wave of what's sure to be market-moving data. On Thursday look for May's consumer inflation report. Prices aren't expected to rise as much as they did in April, but with projections of a 0.4% increase on a core and non-core basis, that's still pretty firm pressure.
Consumer and Producer Inflation Rate Charts
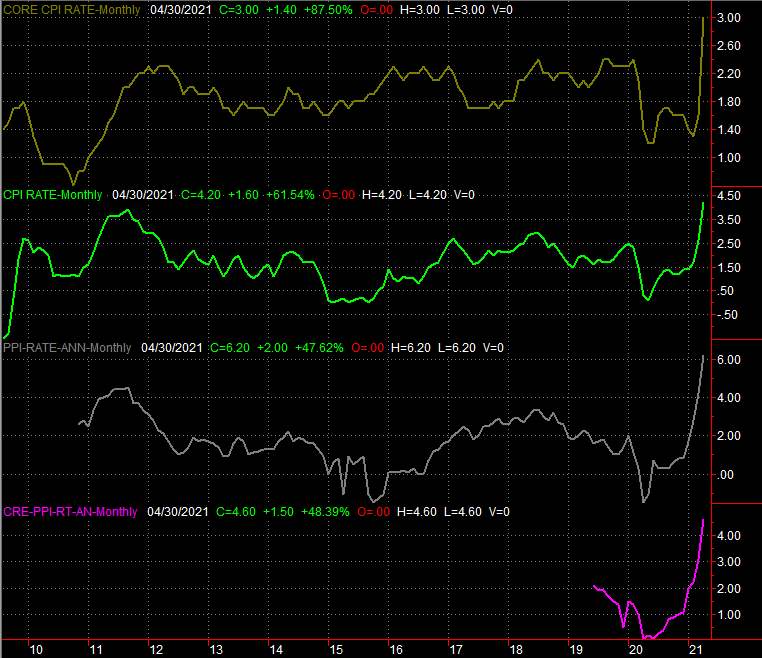
Source: Bureau of Labor Statistics, TradeStation
The annualized consumer inflation rate (core) currently stands at 4.2%, or a more muted 3.0% on a core basis (exclusive of food and energy costs). Investors are understandably restless that the Fed may have to turn hawkish to tamp-down inflation before it swells out of control, so Thursday's report is sure to spur plenty of analysis, and action.
The producer inflation figures won't be coming out until early next week, though they won't be any less watched.
Stock Market Index Analysis
This week's analysis kicks off with a close-up view of the S&P 500's daily chart, as that's the best way to see the most important thing that happened last week. It wasn't a move back above any or all of the key moving average lines -- that happened a couple of weeks before. No, most noteworthy of last week's action is the way the index peeled back from Tuesday's peak to kiss the 20-day moving average line (blue) and start a solid reversal. The bulls drew their line in the sand at the optimal place they could do so.
S&P 500 Daily Chart, with VIX and Volume
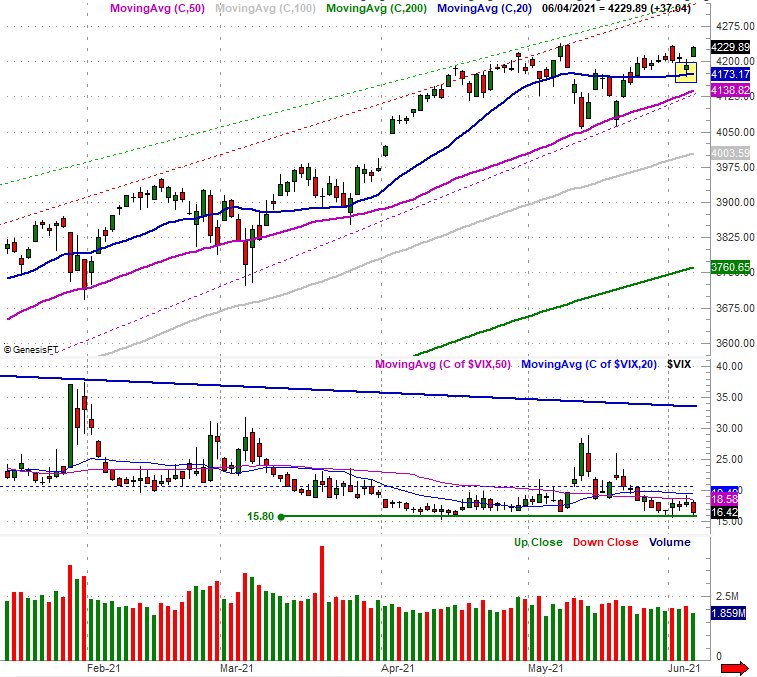
Source: TradeNavigator
Now take a big step back and look at a weekly version of the index's chart. Although plotted on the daily chart, this long-term weekly chart readily shows us the trading ranges (dashed) that have framed the index's progress since October. The S&P 500 is in the middle of that rising range, continuing to take two steps forward and one step back.
S&P 500 Weekly Chart, with VIX and Volume
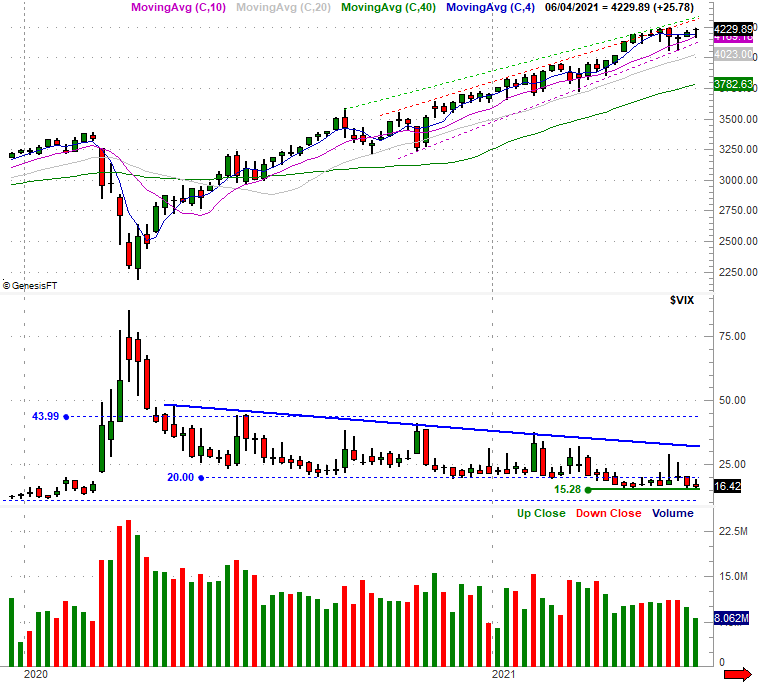
Source: TradeNavigator
There's something else evident on both of the chart's above, however. Notice the S&P 500's Volatility Index, or VIX. The upward reversal it was hinting at just four weeks ago never panned out. That's good, for the bulls. On the other hand, the VIX is still clearly finding support around 15.3. If it can't move any lower, that certainly makes it tougher for the overall market to go higher... not impossible, but at least more difficult.
Thing look similar - although not identical - with the daily chart of the NASDAQ Composite. Like the S&P 500, the NASDAQ found support at and then bounced off of the 20-day moving average line (blue) on Thursday, but also used the 100-day moving average line (gray) as a pushoff point that same day. When two moving average lines converge as a technical floor (and then work), the support is more than twice as meaningful.
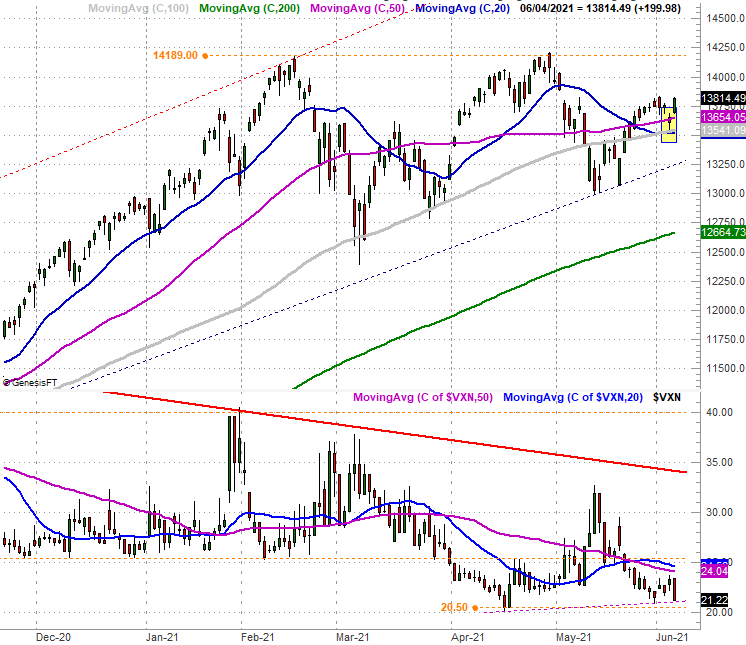
NASDAQ Composite Daily Chart, with VXN
Source: TradeNavigator
The NASDAQ's Volatility Index, or VXN, peeled back to find a floor near 21. As is the case with the VIX, a falling VXN is technically bullish for the market. But, there's seemingly little room for the VXN to continue falling. This could have the effect of cooling the market's rally.
Also notice how, unlike the S&P 500, is well below a technical ceiling near 14,190, established by peaks made near there in February and then again in April. Even if last week's reversal continues to get traction, that's still a major make-or-break level.
Here's the weekly version of the NASDAQ Composite, for more perspective. Notice the NASDAQ is also moving within the confines of a rising trading range (dashed) that's still intact. In fact, being near the lower boundary of this channel means there's a good amount of room before being blocked by the upper boundary, currently near 15,460... and rising. Again though, the horizontal ceiling near 14,190 remains a factor.
NASDAQ Composite Weekly Chart, with VXN and MACD
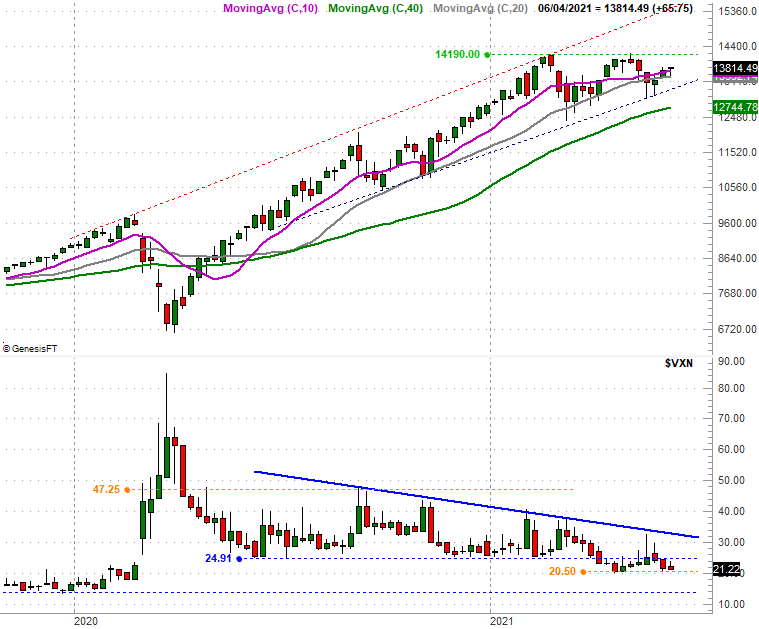
Source: TradeNavigator
As unlikely as the calendar and circumstances make it, the momentum remains bullish. And, while the VXN and VIX are at near-term floors, the weekly charts of both show us that both are capable of falling to even lower lows... the ones hit in late-2019. That leaves us room for further upside, as does the fact that both indexes are not yet at the upper boundaries of rising trading channels. We have to assume the current momentum will remain in place until we can no longer hold that assumption. Nevertheless, we're keeping a close, watchful eye on all the technical floors that kept the rally alive last week. A break under them could still easily turn into a bearish snowball.