Weekly Market Outlook - As Far As Breakouts Go, This is a Poor One
The market was four for five last week, and ended the week at its best close since early November. It also scored the highest intraday high in months on Friday, breaking past a key resistance level in the process. The buyers were hesitant the whole way up though, up to and including Friday's gain. This is anything but a convincing move just yet. The bears still have a good shot at turning the tide in their favor.
This week is going force one camp or the other to take a stand... maybe.
We'll look at how and why the sellers could still up-end the effort this week, after running down last week's economic news and previewing this week's economic data.
Economic Data Analysis
Last week was plenty busy, with the week kicking off with January's retail sales. They were good, but perhaps more important, better than expected. Most important of all, last month's 0.9% improvement (not counting auto sales) largely negates December's surprising stumble. Year-over-year, retail spending grew about 2.5% through most stratifications.
Retail Sales Charts
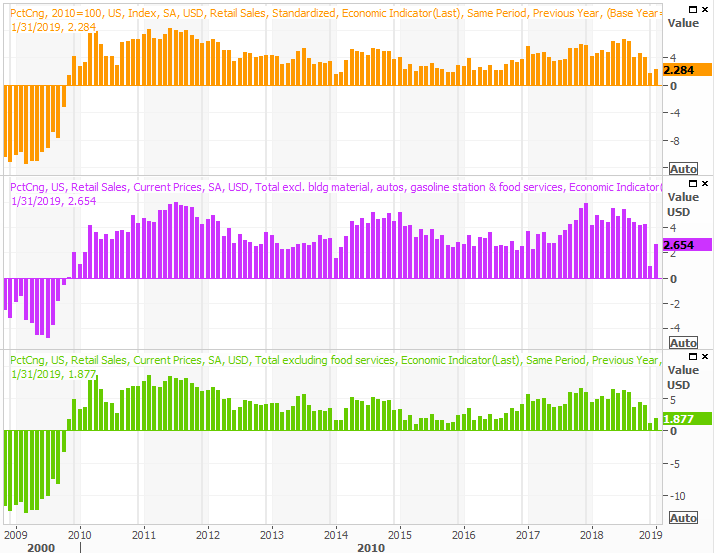
Source: Thomson Reuters
We'd like to see at least slightly stronger spending, but we may well get back to firmer progress when February's figures are reported.
Inflation also remains firm... not too hot, but not too cold. Rather, it's in that 'just right' zone where the Fed doesn't have to be in a hurry to contain in but rising prices suggest there's decent pricing power stemming from healthy buying power. As of the latest look, 'the' inflation rate stands at 1.5%, and at 2.0% when removing food and energy costs.
Inflation Charts
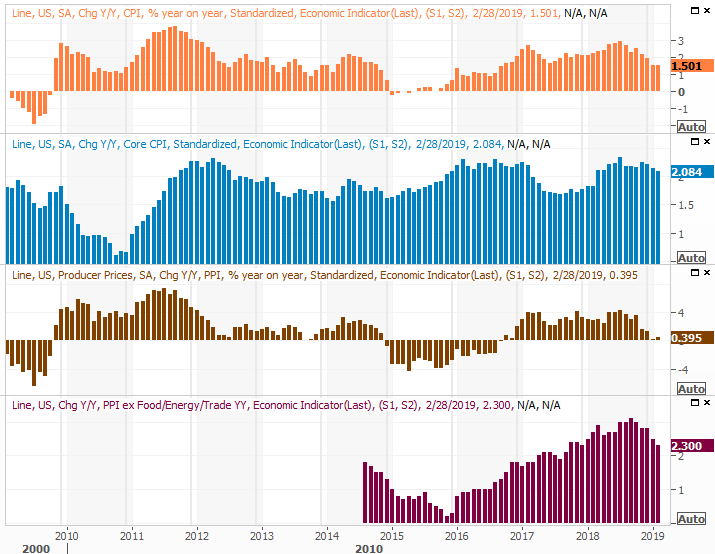
Source: Thomson Reuters
On Thursday we got January's new-home sales report, to round out the bigger-picture look at the housing market we started to take a week earlier. They were ok at 607,000 units (annualized), but that figure fell well short of estimates of 623,000.
New, Existing Home Sales Charts
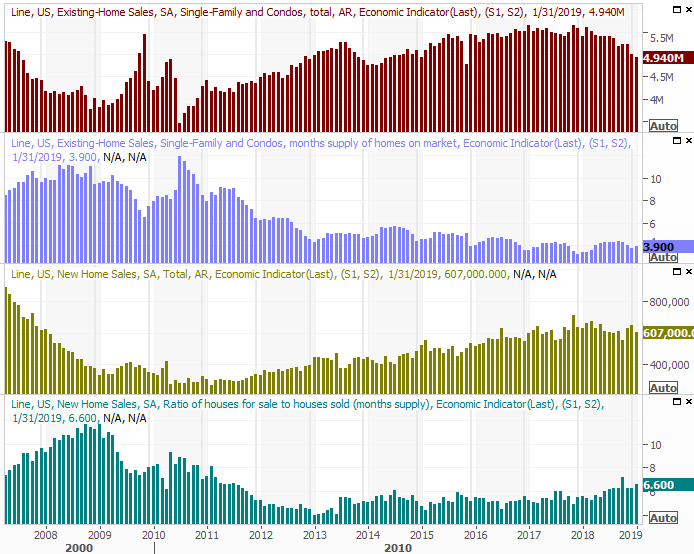
Source: Thomson Reuters
On-balance, it still looks like the housing market is losing its uphill battle. Existing home sales fell in January, and the new-home sales trend remains in a broad downtrend. Inventory levels continues to drift higher as well.
On Friday we get last month's capacity utilization and industrial production data from the Fed... arguably the most important but most overlooked data of the week. Both were up, but both fell short of expectations.
Capacity Utilization, Industrial Production Charts
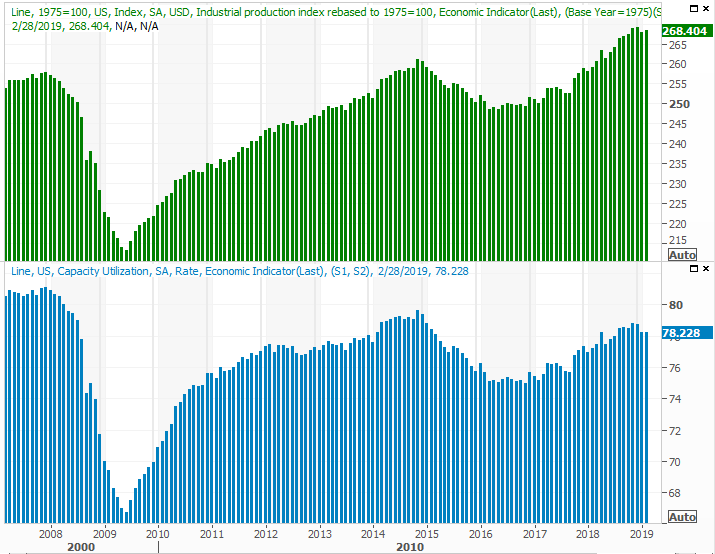
Source: Thomson Reuters
The modest progress might be carry-over from January's lull, which was largely linked to the government shutdown. It looks like we're working our way out of that lull, but it will take at least another month to see it for sure.
Everything else is on the grid.
Economic Calendar
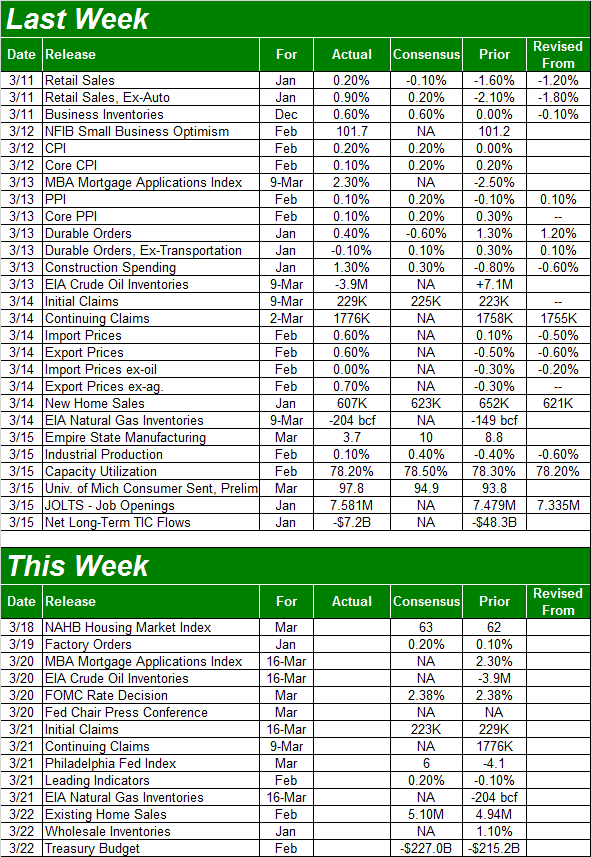
Source: Briefing.com
This week isn't going to be nearly as busy, though a couple of things are worth keeping an eye on.
Chief among those things is Wednesday's decision from the Federal Reserve about interest rates. The market says there's a 98.7% chance the FOMC won't change the Fed Funds rate from the target range of between 2.25% and 2.5%. As always, the rhetoric will be just as important as the actual decision.
Then, on Friday, the existing-home sales figure for February will be posted. The pros are looking for a much-needed but only slight increase. The buzz is that the housing market is on the mend, and that could be confirmed at the end of this week. (The home-sales data appears in the chart linked to the new-home sales discussion above.)
Stock Market Index Analysis
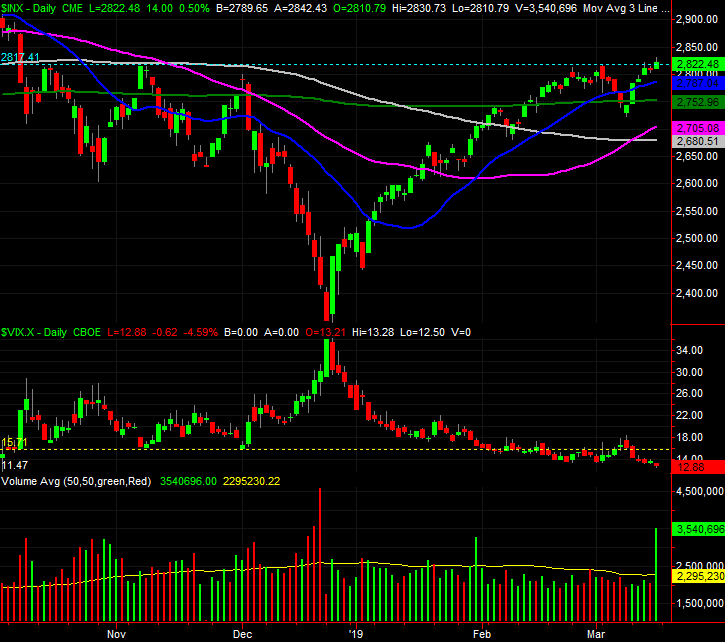
Take everything that happened on Friday with a big grain of salt. Not only was it an options expiration day, it was a quadruple witching day, which saw the expiration of monthly as well as quarterly options and futures. That explains the volume surge, but it also taints the day's action. The market ended up making a technical break above a key resistance line, and we also saw a new multi-month high. But, that may have been entirely attributable to traders exercising their options.
S&P 500 Daily Chart, with Volume
Source: TradeStation
Still, where the S&P 500 ended things on Friday is where - and how - it starts matters on Monday.
To that end, while Friday technically constituted a breakout move, it's an anemic one. The uptrend was slowing the whole week long, and the market is still good and overbought from the late-December recovery move.
Zooming out to the weekly chart of the S&P 500 puts things in perspective. The gains reaped over the course of the past twelve weeks are some of the fastest ever seen. Granted, they followed some of the fastest selling ever seen. Nevertheless, a stabilization of the pacing to more normal levels could still easily involve a pullback.
S&P 500 Weekly Chart, with Volume
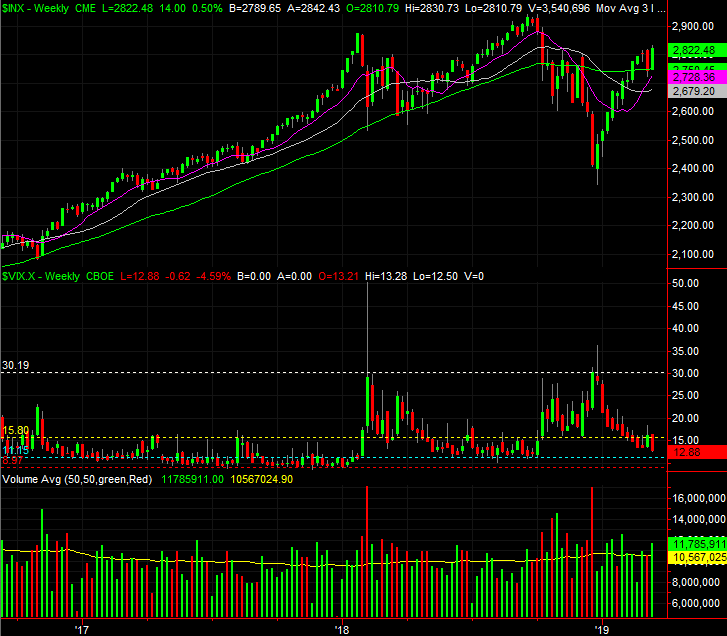
Source: TradeStation
Bolstering the bullish case - though not decidedly so - is the fact that the VIX is nearing a key floor at 11.15 (blue), and within sight of another key floor at 9.0 (red). It's not quite to either just yet though, so there's still some room for the bulls to continue charging. The fact that the S&P 500 recently crossed above its 200-day moving average line also implies the undertow is still pushing things forward.
The NASDAQ's chart tells the same basic story.
NASDAQ Composite Daily Chart, with Volume
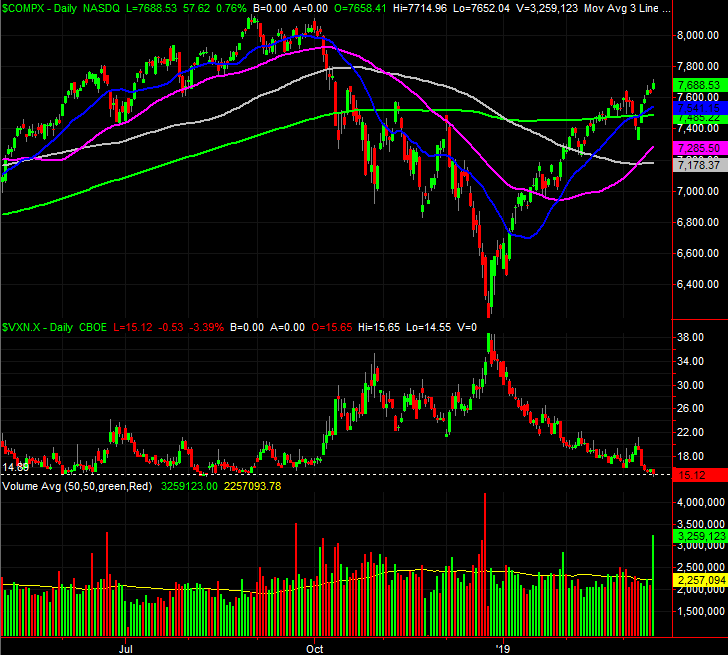
Source: TradeStation
Ditto for the NASDAQ's weekly chart.
NASDAQ Composite Weekly Chart, with Volume
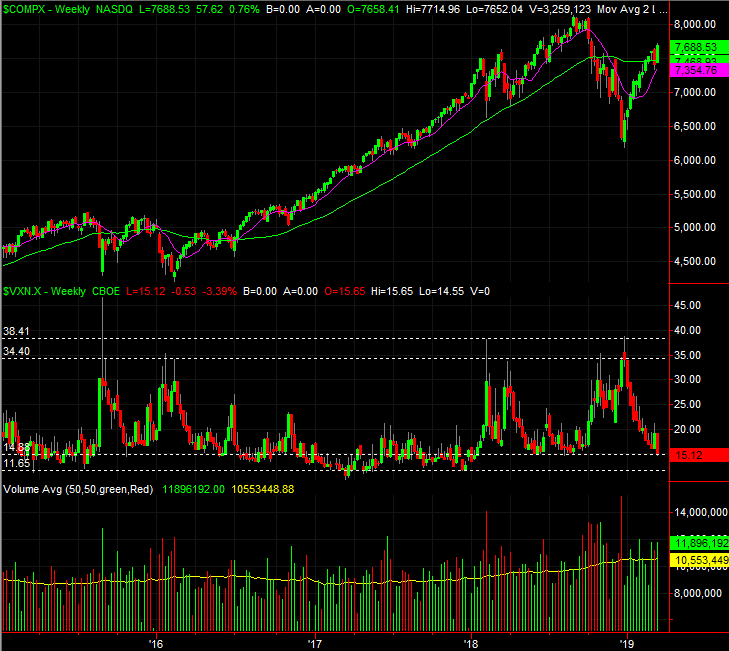
Source: TradeStation
Or, maybe last week's flawed gain is still enough to inspire investors to keep on buying this week. It's largely a matter of rhetoric, which is largely a matter of perceived progress on the trade war front (or at least reason to assume it's not all that relevant). To that end, Wednesday's decision from the FOMC will significantly help shape that rhetoric.
This is very much a "wait and see" situation. Quadruple witching or not, the buyers have been very hesitant here. That's not likely to change this week. The would-be bulls are waiting for more certainty that they can trust what they've seen so far. They may need to see stocks peel back and then rebound with some zeal before the trust in the effort.
Yes, we saw that happen a couple of weeks ago, but it wasn't much of a test. The market really needs be tested before we can make sweeping conclusions. And, any new rally needs to start slower and then accelerate.
Instead, what we've seen are sharp rebound moves that lead to immediate slowdowns which inspires profit-taking. Ideally (and ironically), the S&P 500 would peel all the way back to its moving average lines around 2700 before we start making major calls about how strong or weak the market is here.
The last thing the bulls want to see here? More bullishness straightaway. That's fruitful to be sure, but would drive the VIX to "too low" levels and leave the market indices far too overbought from their late-December lows to continue rallying.
We'll have to wait and see how it all shakes out.