Weekly Market Outlook - Another Week, Another Record
 Once again the bears had an opportunity (and ample reason) to stop this rally cold, and once again the bulls prevailed.... valuations and the technically-overbought condition being largely ignored. It's the fourth straight week the S&P 500 logged a gain moving deeper into record-high territory.
The old problems/risks still linger. Chief among them is extreme, almost-dangerous confidence, as evidenced by an alarmingly low VIX and VXN. Then again, that hasn't mattered in months. Why should it matter now?
We'll look at just how overextended the rally is below (even by bullish-year standards) after a run-down of last week's and this week's economic news.
Economic Data
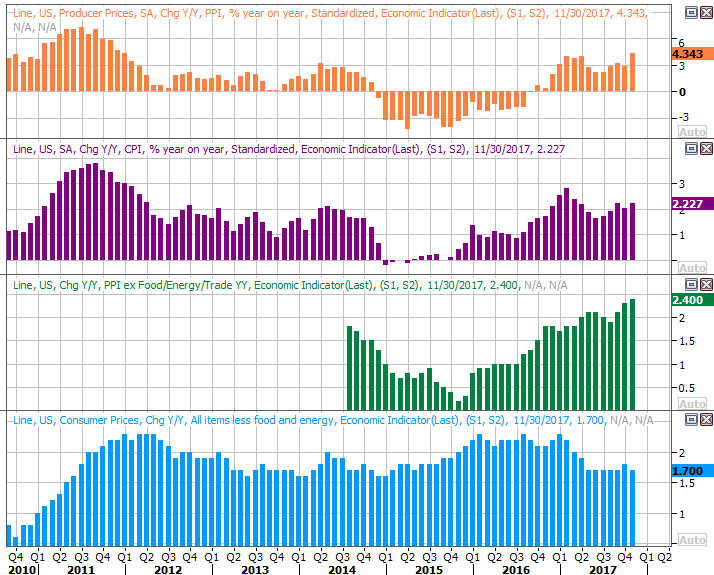
There's plenty of news from last week to sift through, but there's no reason to hold off on looking at the big Kahuna; Tuesday's and Wednesday's strong increases in producer and consumer inflation was all the green light the Federal Reserve needed to ratchet interest rates up by a quarter-point this month. More are apt to be in the cards for 2018 as well, as stronger economic growth is starting to drive serious inflation.
On that note, the annualized producer inflation rate now stands at 4.3%, while the consumer inflation rate is 2.2%. On a core basis, the figures are 2.4% and 1.7%, respectively. That's at the Fed's target, and still rising. The Fed has to act sooner than later, if not both.
Producer, Consumer Inflation (Annualized) Charts
Source: Thomson Reuters Eikon
Underscoring the idea that the economy is heating up and demand is being whipped up, retail spending grew in spades last month. Year-over-year, consumer spending was up in excess of 6% in all stratifications.
Retail Sales Growth (Annualized) Charts
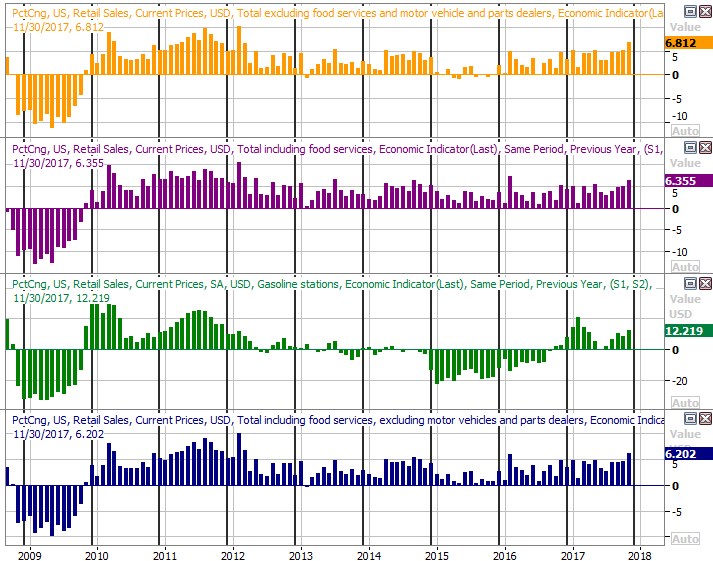
Source: Thomson Reuters Eikon
Last but not least, November's industrial productivity and capacity utilization were both up, though neither as much as expected; consumers are doing more than their fair share of heavy lifting. Both are in serious uptrends though, which as we've noted in the past correlates very well with corporate earnings.
Industrial Productivity and Capacity Utilization Charts
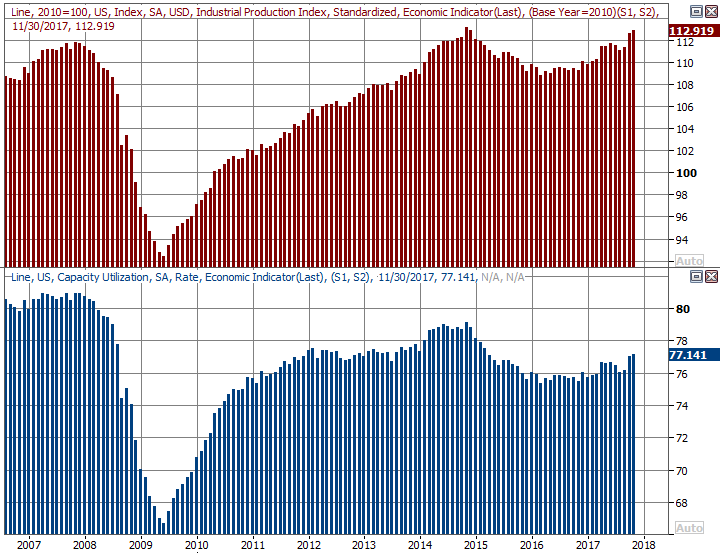
Source: Thomson Reuters Eikon
Everything else is on the grid.
Economic Calendar
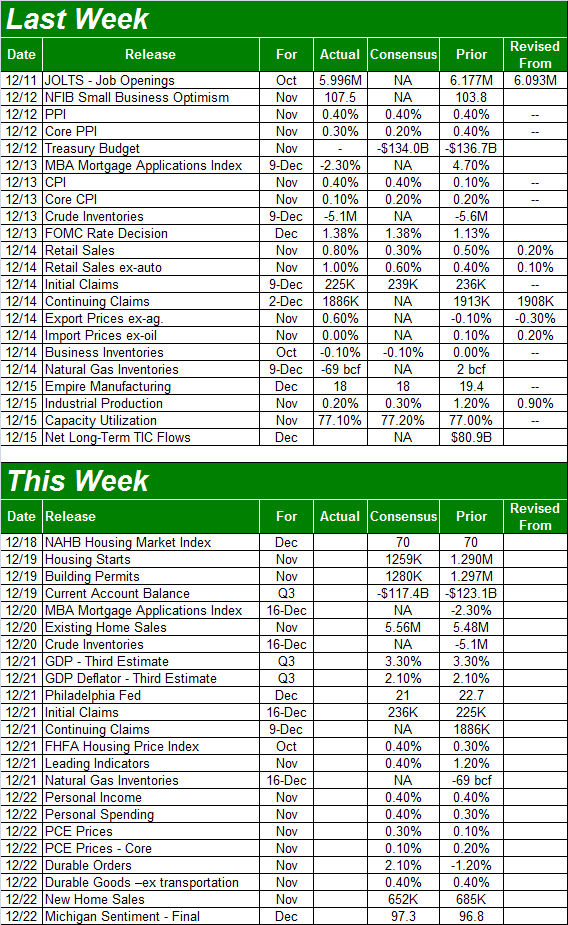
Source: Briefing.com
This week is jam-packed too, with the bulk of the data in the pipeline pointing at the housing market's health.
On Tuesday we'll hear about last month's housing starts and building permits. You'll recall October's figures were strong, offsetting September's lull stemming from a couple of hurricanes. The pace is expected to edge a little lower, but still roll in at strong levels.
Housing Starts and Building Permits Charts
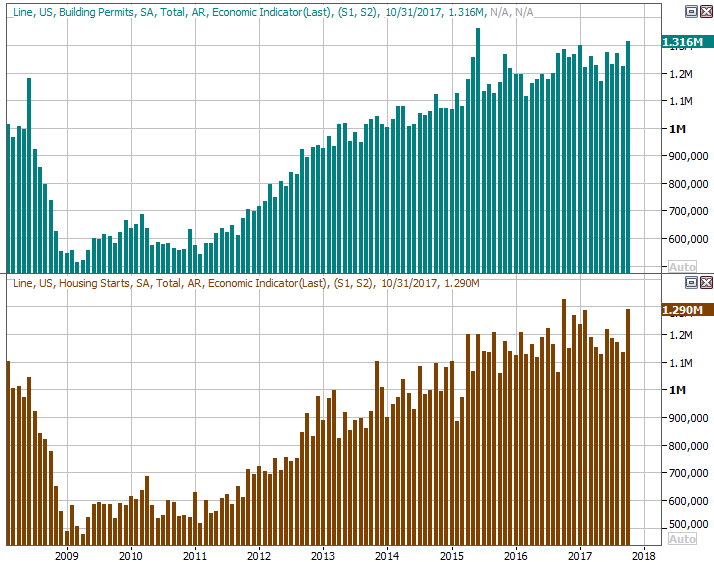
Source: Thomson Reuters Eikon
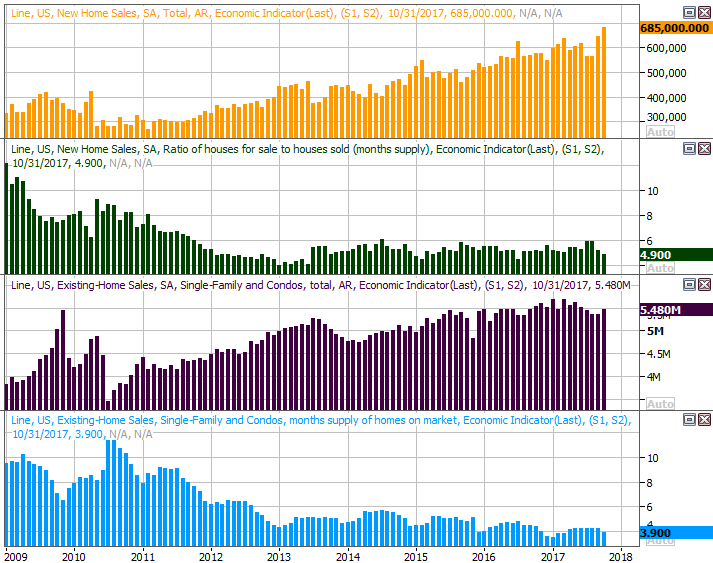
On Wednesday we get November's existing home sales, and we'll round out that data Friday with the new-home sales report. The pros are calling for more activity on the existing-home front, though a little less on the new-home front. Then again, October's new-home sales were very, very strong. Also notice inventory is limited, perhaps holding purchases back.
New and Existing Home Sales, Inventory Charts
Source: Thomson Reuters Eikon
On Thursday look for the FHFA's look at home prices for October, though we won't hear the comparable Case-Shiller figure until next week. Both are in firm uptrends as well, perhaps pointing back to the limited inventory we see on the chart above.
FHFA, Case-Shiller Home Price Charts
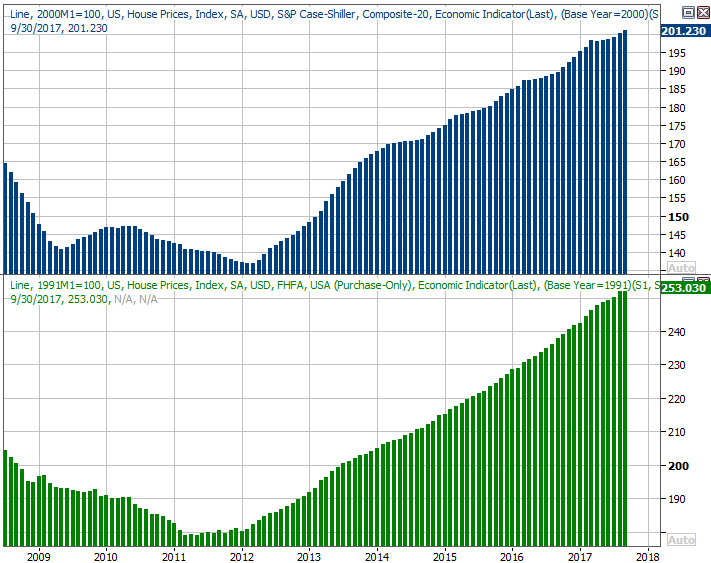
Source: Thomson Reuters Eikon
We don't have preview charts for them (due to a lack of time and space), but note that we'll get a third and final Q3 GDP reading on Thursday and a crude-inventory report on Wednesday. The crude-stockpile report should be particularly interesting. It's been trending lower for some time now. Crude prices haven't been driven consistently higher, but it's getting tough to say the U.S. is overproducing now.
Index Analysis
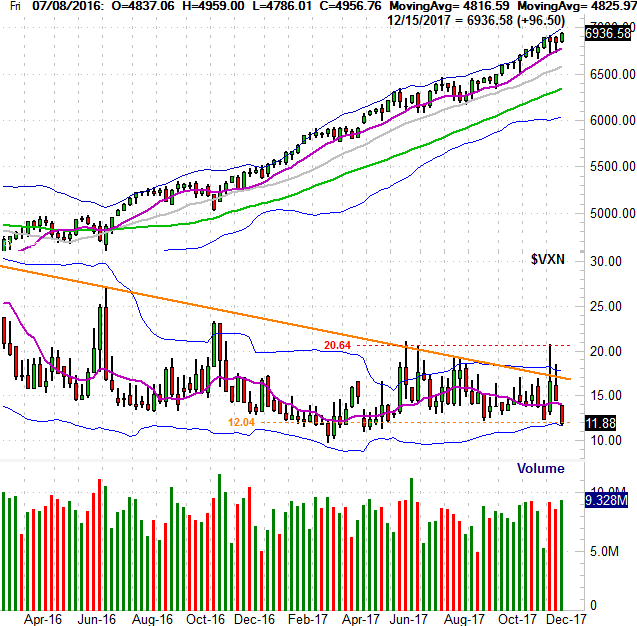
We'll start this week's analysis with a look at a weekly chart of the NASDAQ Composite, not to make a point, but to offer some much-needed perspective on how long this rally has lasted without any kind of major disruption. By most measures, this is the second-longest bull market ever, and at roughly 400 days now, this is the market's longest rally ever without a 3% correction. We've gotten close to that size of a stumble, but we've not logged on yet, and clearly we're not teetering on the edge of that kind of setback. (The S&P 500 chart more or less looks the same as the NASDAQ's, but the composite just illustrates the straight-line nature of this move better.)
NASDAQ Composite Weekly Chart, with VXN and Volume
Source: TradeNavigator
Note the VIX is back at an (almost) absolute low.
And there's the rub. Though the momentum is decidedly bullish and there are no clear signals that technical trouble is brewing, there's something uneasy about how all of this has panned out. It's almost too perfect.
Still, earnings are growing, and the prospect of a major tax overhaul is undoubtedly going to help corporate bottom lines even more than they're helped by economic expansion.
This is also a nuanced rally though... perhaps one of the reasons it's been allowed to persist as long as it has. One of those key nuances is, though persistent, it's never been red hot or raced out of control. Rather, it's been a move marked by steady-Eddie flow, with one step back for every two steps forward. We may be on the verge of taking one step back.
The explanation is easy to see on the daily chart of the S&P 500. It's here we can see the index bumped into its upper Bollinger band with Friday's surge. Looking back though the middle of the year, while we can clearly see a mere move into the upper band doesn't inherently mean a dip is taking shape right away, we have good reason to believe this is where the rally starts to slow again, leading into small pullback.
S&P 500 Daily Chart, with VIX and Volume
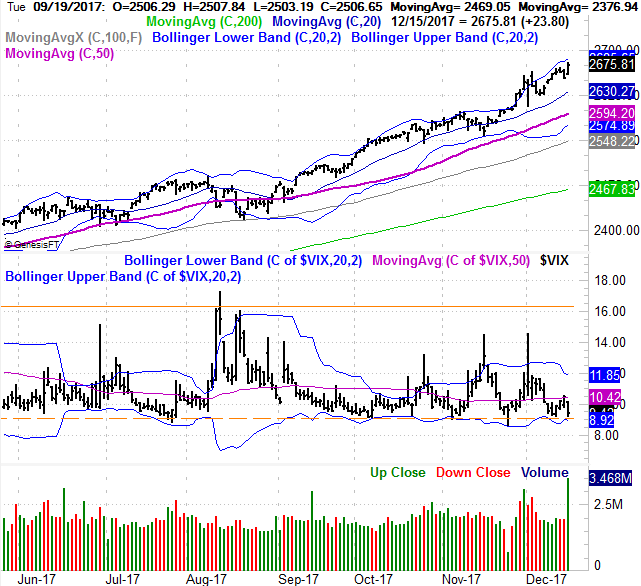
Source: TradeNavigator
Just don't confuse a small pullback with a major correction, and don't confuse a major correction with a bear market. As long as the 100-day moving average line (gray) at 2548 holds up as a floor, the trend will be fine.
With that as the backdrop, if you're feeling uneasy about the whole thing, know that you're now crazy. This is a very unusual move, though not necessarily one that's going to come to a screeching halt between now and the beginning of the year. As our graphic below makes clear, thanks to the recent wave of bullishness, the S&P 500 has raced ahead of its usual to-date bullishness for the average year in which the S&P 500 logs a gain.
S&P 500 Performance YTD, vs. Avg. Year and Avg. Bullish Year
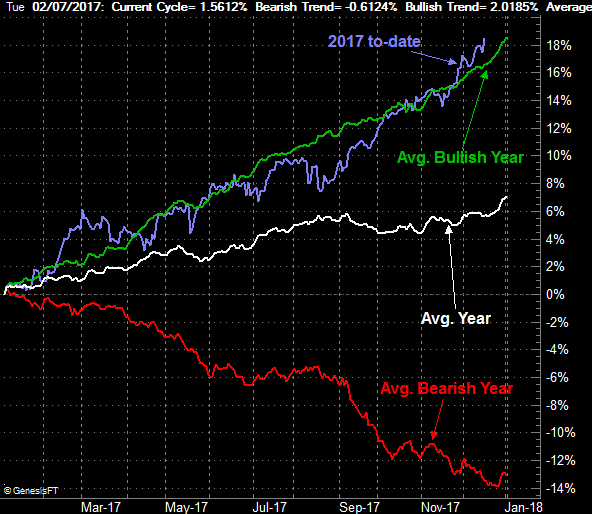
Source: TradeNavigator
The thing is, while ahead of the curve, so to speak, you can also see that the last two weeks of any year are generally very bullish ones. As it stands right now, this year's last two weeks have every reason and opportunity to continue the move into record high territory, as unlikely as it feels like it should be.
Of course, this is a market that loves to throw curve balls. If for some reason the suggested tax overhaul isn't put into place before the end of 2017, that may well serve as the catalyst for an overdue correction.
Again, that doesn't have to mean the beginning of a bear market.