Weekly Market Outlook - A Good Start, But It's ONLY a Start
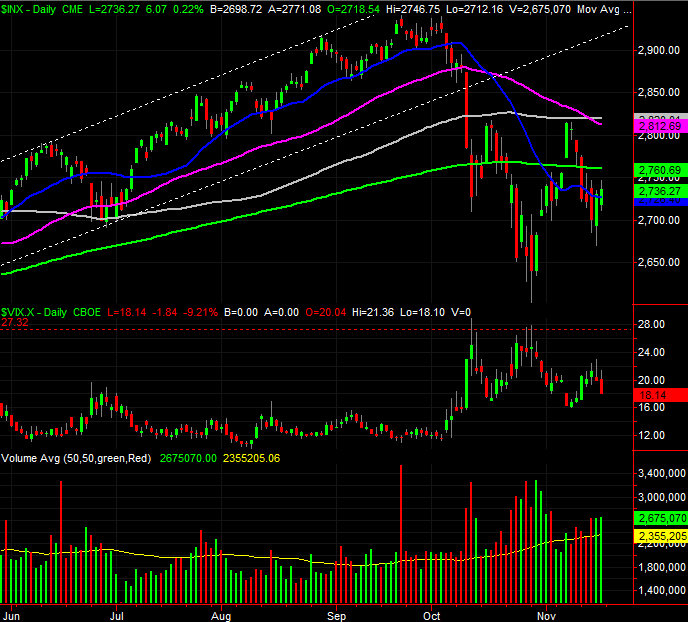
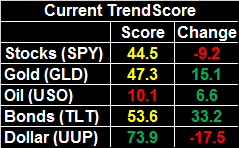 The trading week certainly started on the wrong foot, but the bulls didn't let things tumble out of control before stepping back in. The buyers were able to lock in a huge reversal on Thursday, and we got some pretty good follow-through on the effort with Friday's trading. The indices aren't back above the major lines in the sand we need them to be to be fully bullish, but we're close, and pointed in the right direction.
We'll weigh it all below, as we always do. Also as always though, let's first paint the bigger picture with the broad brush strokes of economic information.
Economic Data
What a week! Though earnings season is winding down and the political rhetoric is ramping up again, there's just as much economic information to sift through as there always is... maybe more.
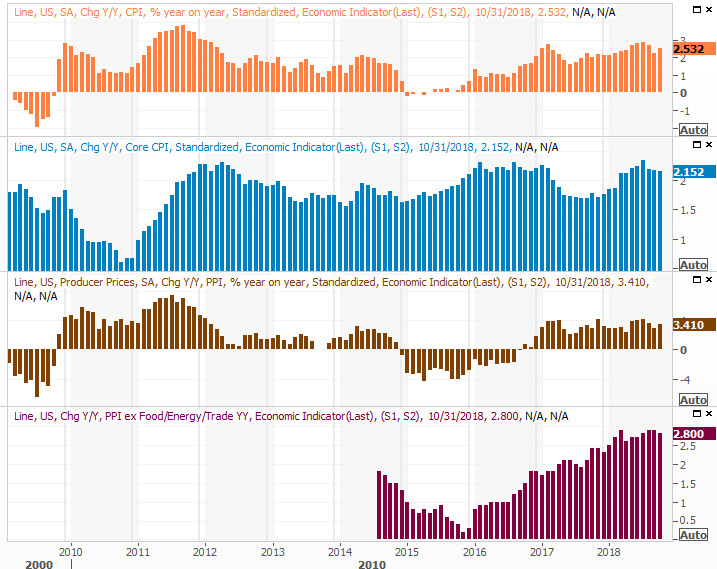
The party started in earnest on Wednesday, when we rounded out the inflation picture by looking at October's CPI data. The month to month rates rolled in as expected, up 0.3% overall and up 0.2% not counting food and energy. More telling though, on an annualized basis the overall inflation rate is 2.5%, and 2.1% on a core basis. For producers, the figures are 3.4% and 2.8%, respectively.
Producer, Consumer Inflation Charts
Source: Thomson Reuters
This is a Goldilocks report, in that inflation is neither too hot nor too cold. The Federal Reserve could be slightly less hawkish with rate-hike plans if it wanted too, though it doesn't have to back off. It just needs to not get overly aggressive in 2019.
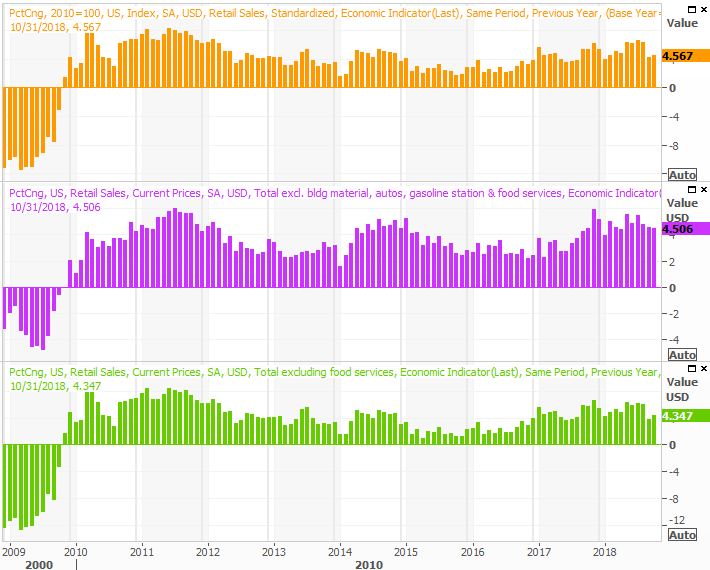
Also this past week we got last month's October retail sales data. It too was good, and better than expected.
The knee-jerk interpretations of the report aren't quite as optimistic, with critics pointing out that spending growth for the past couple of months has been lower than the growth pace seen in the middle of the year. What's being lost in the discussion is that the recent comparisons are up against tremendous spending growth in September and October. Either way, spending growth in excess of 4% is still quite healthy. Investors have been spoiled by amazing growth rates that can't mathematically be sustained.
Annualized Retail Sales Growth Charts
Source: Thomson Reuters
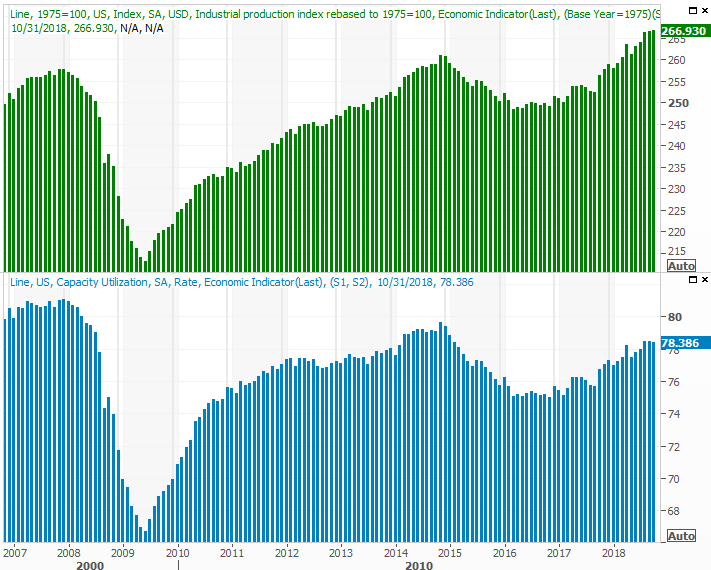
Finally, last week's other biggie was October's capacity utilization and industrial productivity report... arguably the most important barometer of economic activity, and one of the most highly correlated with corporate earnings. Though already near 'maxing out' in terms of usage of our manufacturing potential, output managed to continue edging higher.
Industrial Productivity and Capacity Utilization Charts
Source: Thomson Reuters
As long as both data sets keep trending upward, it will be difficult to not remain a bigger-picture bull.
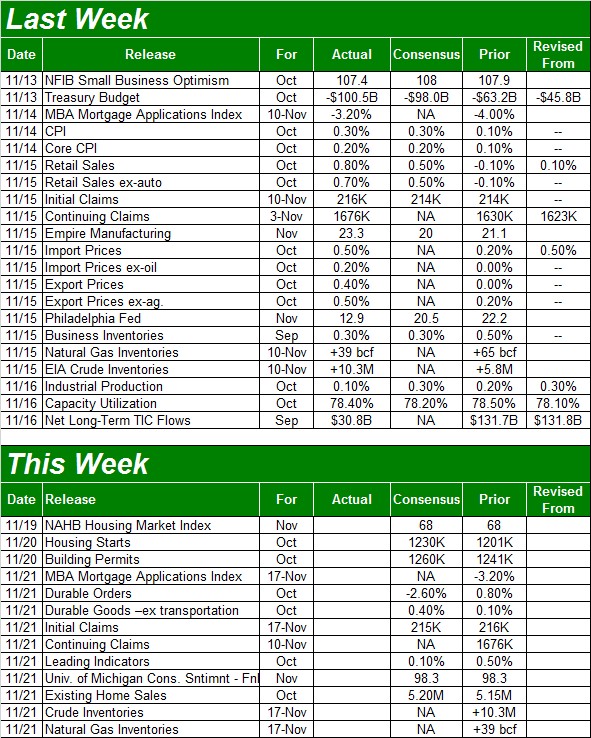
Everything else is on the grid.
Economic Calendar
Source: Briefing.com
This week won't be quite as busy, which works out nicely since many investors will be distracted by the Thanksgiving break. There are a couple of big reports in the pipeline, however, particularly if you've been trying to keep your finger on the pulse of the real estate market.
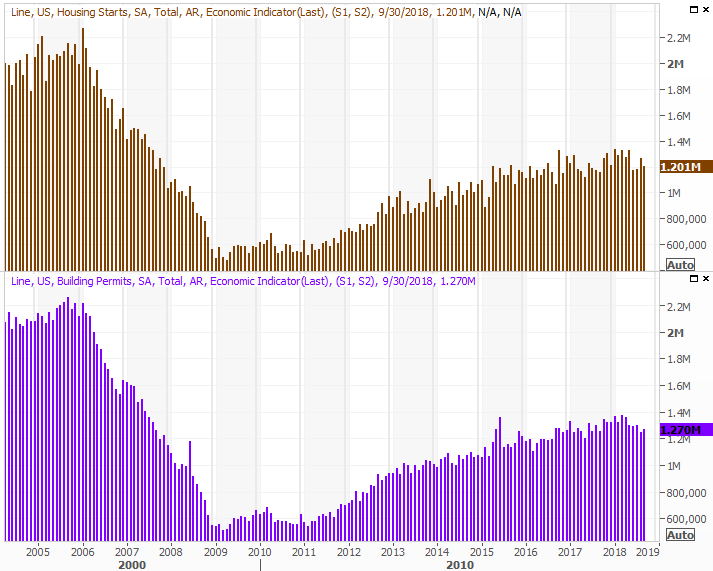
On Tuesday we'll hear about last month's housing starts and building permits. Both have been trending lower since early this year, with the slowdown more or less coinciding with rising interest rates and real estate prices that have reached uncomfortable levels.
Housing Starts and Building Permits Charts
Source: Thomson Reuters
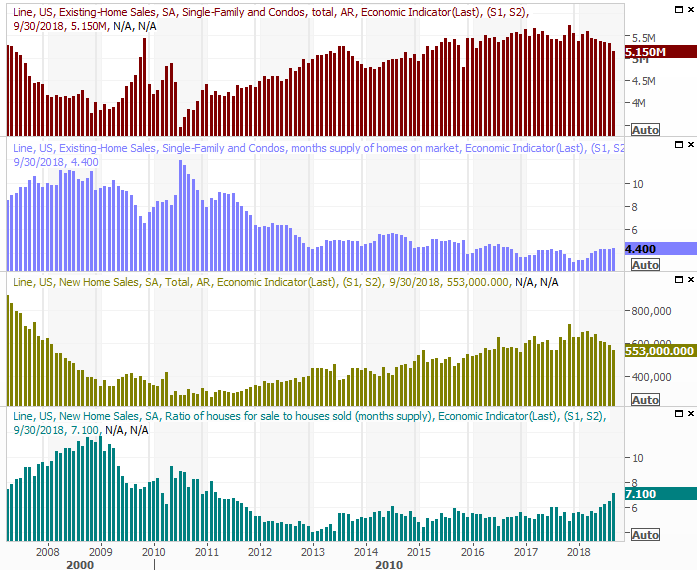
On Wednesday we'll get October's existing home sales pace, though we won't get last month's new home sales pace until next week. The two go hand-in-hand. Either way, both have been trending lower, in conjunction with fewer starts and permits. We need a ray of light on this front, though it doesn't appear we're going to get it this time around.
New, Existing Home Sales and Inventory Charts
Source: Thomson Reuters
Index Analysis
The S&P 500 didn't clear its big hurdle with last week's rebound effort, but it cleared a minor one, and that's a start. Besides, with or without that feat, a couple of other clues are pointing to bullishness ahead.
The big hurdle is the 200-day moving average line, plotted in green, currently at 2761. The minor hurdle that was cleared is the 20-day moving average line at 2729, plotted in blue. The bears had a chance to put the market back into a nosedive, but the buyers never let them get a good chance.
S&P 500 Daily Chart, with Volume

Source: TradeStation
As for the other hints that at least offer some encouragement, chief among them is the daily volume. It was strongest on Thursday and Friday of last week, on the "up" days. That's a good sign that there are more buyers than sellers here, and the clue is made even more bullish in that Friday is typically a lower-volume day because people want to get an early start to their weekend.
The other bullish sign is the fact that the VIX is starting to trend lower in earnest.
It was an options-expiration day, which would arguably affect the VIX's value (as well as the put/call ratio). It just doesn't look like that was much of a factor on Friday though. The VIX's pullback looks like it was going to happen organically anyway.
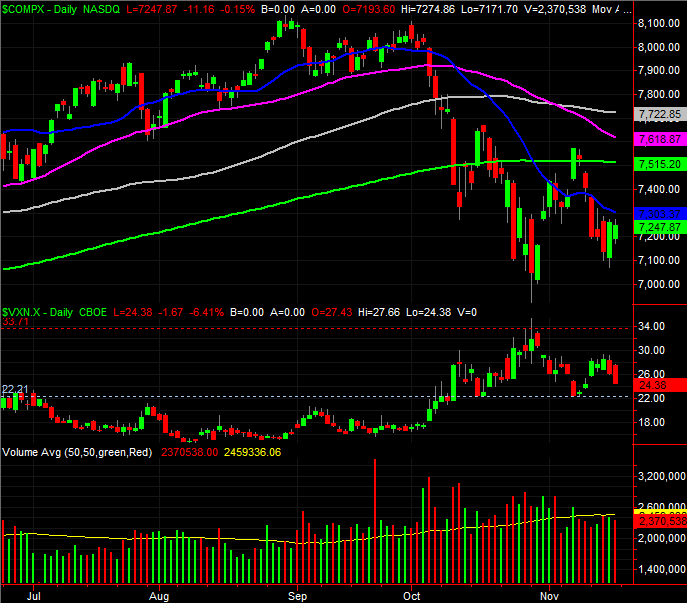
The NASDAQ Composite chart didn't pass as many milestones as the S&P 500 did... a concern, as the NASDAQ is supposed to lead rather than lag. Namely, the composite didn't manage to crawl back above the 20-day average, instead losing ground on Friday. Notice, however, that Friday's volume on Friday was actually less than Thursday's "up" volume. The weakness still may not be the majority opinion.
NASDAQ Composite Daily Chart, with Volume
Source: TradeStation
As always, zooming out to a weekly chart of the S&P 500 helps put things in perspective, though it doesn't actually tell us anything new. The market isn't bleeding anymore, but it's on the wrong side of long-term trend lines.
S&P 500 Weekly Chart, with Volume

Source: TradeStation
The call? The trend, to be blunt, isn't actually all that bullish, though this time of year usually is. Thursday's and Friday's action is also what a turnaround would normally look like, even if it's not solidified all that much yet.
The good news is, there's a pretty clear line in the sand that will confirm the uptrend is fully in motion.
Let's zoom back into a daily chart of the S&P 500. Pay particular attention to where the 50-day (purple) and 100-day (gray) moving average lines are, right around 2815. That's also where the index topped out the last two times before it made some pretty significant pullbacks. There's something about that level.
S&P 500 Daily Chart, with Moving Average Lines

Source: TradeStation
Until that happens, anything could happen... in terms of squelching the budding uptrend. And, if this turnaround effort is to have any hope of getting meaningful traction, the NASDAQ is going to have to take the lead, and FANG stocks are going to have to lead the NASDAQ.
