For some, the fact that stocks didn't finish Monday with a gain is interesting, though hardly alarming. The market has hit several consecutive record highs over the course of the past few days, and is deserving of a break.
There are a couple of red flags waving now, however. You just have to look a little deeper and a little longer to see them.
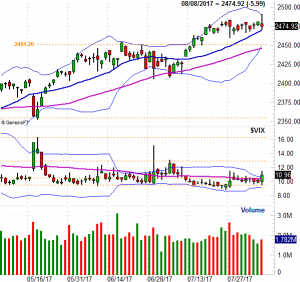
The first of the warning signs is the scope of Tuesday's action. It wasn't that the S&P 500 (and other indices as well) couldn't make progress. Indeed, at one point Tuesday's intraday gain was the biggest we'd seen since mid-July. The problem was — and is — the S&P 500 and other indices couldn't hold onto that gain. After running up to a high of 2490.87, the index peeled back to a close of 2474.92. That was the biggest intraday swing (in the wrong direction) we've seen in a while.
 [1]
[1]
It's not just the inability to hold onto a gain that's so alarming though.
Veteran traders may recognize the concerning shape of Tuesday's bar, with an open and close closer to the low for the day than the high. Called a doji bar, this kind of pattern after a prolonged rally often marks the pivot point from an uptrend into a downtrend. We need downward follow-through to confirm the signal, and of we get it in this case, it will be underscored by a move under the 20-day moving average line… which played a support role on Tuesday.
And with the market vulnerable to profit-taking, a bearish nudge could end up starting a selling chain reaction (at least until a test takes shape around 2450).
It's not just the failed bullish follow-through on Tuesday that should be noted by all investors though. There's also the more subtle fact that in many ways investors are already posturing defensively by moving to safer stocks and away from more aggressive arenas.
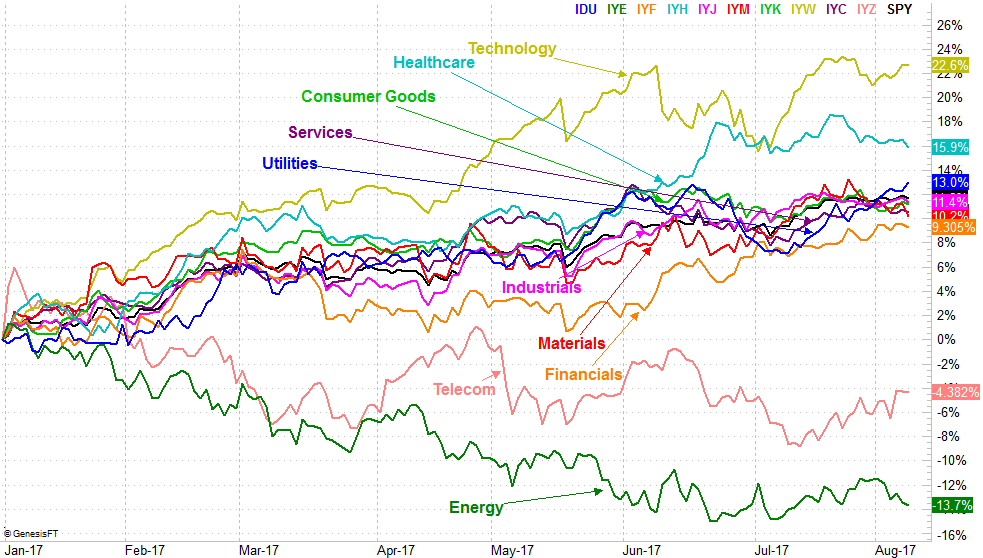
In short, not every sector lost ground on Tuesday. The boring ol' utility stocks managed to gain 0.15%, while healthcare and energy stocks lost 0.5%. Materials stocks were down 0.7%. This suggests a flight to safety, and away from risk.
Here's the thing… this is a trend, or sector rotation, that's been subtly unfurling for a while now, with most people not even realizing it. The performance chart of all the key sectors below tells the tale effectively. For the longest while utility stocks were stuck in the middle of the pack, but just this week have broken away in a bullish direction. Conversely, healthcare stocks are starting to cede their leadership spot. Telecom stocks, which are considered another "safe" sector, are also starting to pull up and out of a slump.
 [2]
[2]
The one name that needs to fall to really set the sector rotation red flag into high gear is the technology sector, but it's still leading. Give it time though.
Maybe there's nothing to all of this. Maybe it's just the usual volatility and listlessness we see this time of year. Or, maybe there's something to is worth heeding. Better to be ready for something that doesn't happen than not ready for something that does end up happening, and wreaking havoc on the broad market. As they say, knowing is half the battle.