
With nothing more than a quick glance, it would be easy to assume the recent volatility from the broad market is just "more of the same." Stocks have been hot and cold for a while now, so there's no reason to think they won't be in the foreseeable future.
Digging deeper into the details, however, reveals something is indeed changing with the market. Namely, sectors that had been just so-so (or even weak) are starting to heat up, while sectors that had been leading are now imploding. This is a not-so-subtle, though largely overlooked, clue that investors are starting to change their minds about a lot of things… perhaps without even realizing.
One simple chart illustrates — and verifies — the point quite nicely.
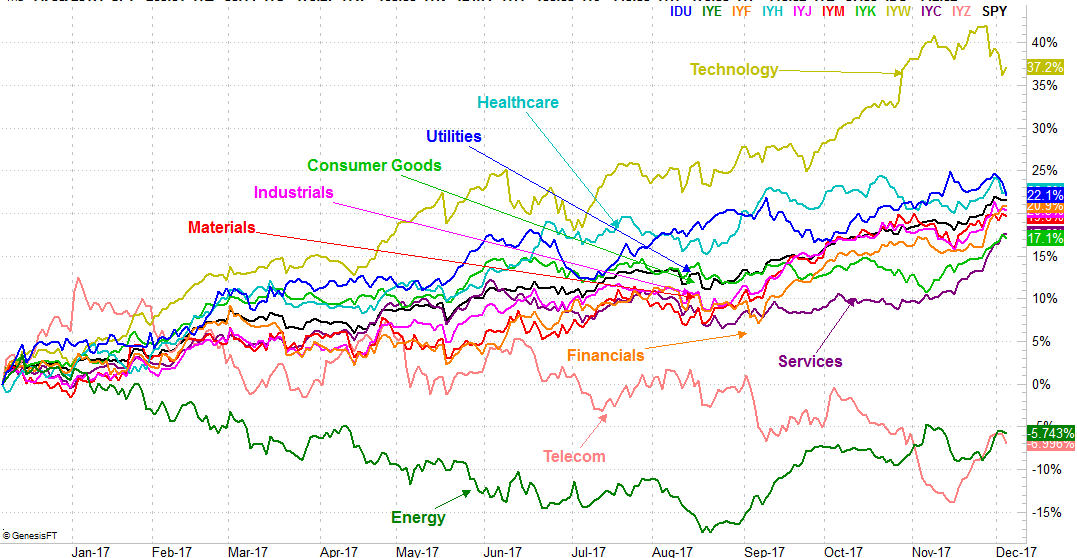
Take a look at the performance comparison chart for the past twelve months. Tech stocks were leading the charge until a couple of weeks ago, but began to unravel late last month. Meanwhile, the services sector and the consumer goods sector have woken up from a lackluster year and outpaced everything else for the past month. [Click the chart to see the full-screen version.]
 [1]
[1]
It's a sign that traders are moving towards a more defensive mindset, getting out of more aggressive areas and moving into more defensive stocks. If they're thinking along those lines now, it may only be a matter of time before they create a self-fulfilling prophecy.
To be clear, this is hardly the ideal red flag of a move into safer havens. The utilities sector, for instance, has shockingly enough been the second-best performer for the past twelve months, but actually started to fall with tech late last month. It's one of the most defensive arenas there is, though the market's been treating it like a growth sector.
The materials sector, meanwhile, has remained surprisingly bullish even though the broad market hinted at headwinds a week ago. Materials names should rise and fall with the overall market rather than move in contrast with the bigger trend.
Still, many of the disparities we've seen take shape over the course of the past year are starting to be undone, signaling a mass-rethinking of…. well, everything.
With that as the backdrop, it's not as if we've not seen some new red flags from the broad market itself.
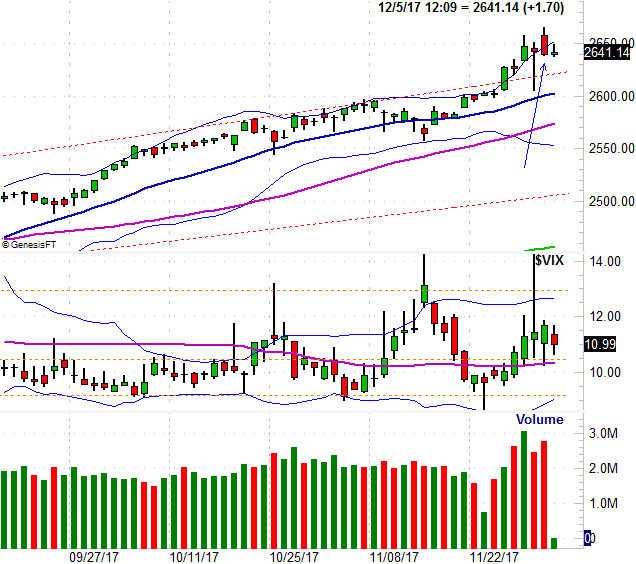
Using the S&P 500 as our proxy, we can say with clarity that the last few days have not only been more volatile than usual, but more undecided than usual, leaving behind huge intraday swings. That wild intraday volatility is in and of itself often seen at short-term market tops.
Of particular concern is Monday's bar (marked with an arrow). On the previous day — Friday — we saw a hammer-shaped bar which generally marks a bullish pivot; stocks should have followed through on Friday's intraday rebound on Monday. And for a while, they did. By the time Monday's closing bell rang though, the S&P 500 had fallen all the way back to a small loss. This in many regards implies the rally is now out of gas. Tuesday's slight pullback underscores this idea. Again though, it's the big swings all over the map for the past week and a half that suggests there's a bigger pivot unfurling here. [Click the chart to see the full-screen version.]
 [2]
[2]
It hasn't happened yet, and truth be told, we can't even worry about a corrective move until the S&P 500 breaks under its 50-day moving average line (purple) currently at 2572. Yes, we have to give the market that much leeway. We also can't stress too much until the VIX gets and stays above the 13.0 level. It may not be in the cards, especially knowing we're now in one of the most bullish times of the year.
As they say though, expect it when you least expect it. The market loves to do the unexpected. Just don't jump the gun and mistake a little bearish volatility as the beginning of a more meaningful pullback.