Is the S&P 500 a 2008-style meltdown or a bear trap?
by Simon Maierhofer [1]
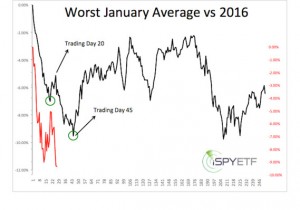
Intense selling dominated the first 20 days of 2016, but the next 20 days were chewed up by sideways trading without any net progress. Here is the year-to-date “tale of two markets” at a glance.
 [2]
[2]
Periods of intense selling tend to spark discussions about market crashes or recoveries. In reality, periods of emotional intensity are typically followed by drip-torture style (volatile) rangebound trading (with the exception of the 2013/14 V-shaped recoveries). That's what we've seen the past 20 days.
The question is this: What happens after the rangebound period ends? Here are some clues:
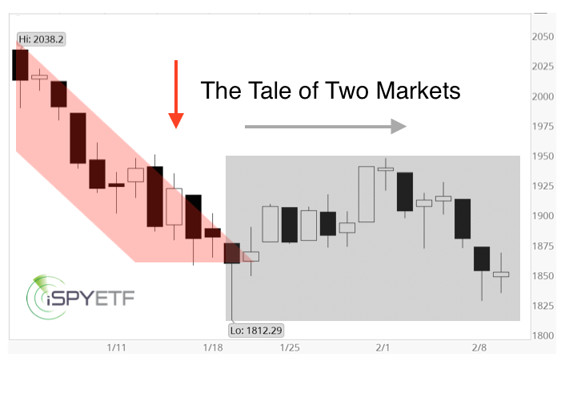
The ‘Terrible January Pattern"
The S&P 500 (SPX) (SPY) lost 5.07% in January. Since 1970, the S&P lost more than 5% in January seven other times (1970, 1977, 1978, 1990, 2000, 2008 and 2009). The chart below plots the average annual performance of those years (black graph) against the year-to-date performance (red graph).
 [3]
[3]
The initial panic low (on average after 20 trading days) is usually followed by a bounce and another low (on average after 45 trading days) before carving out a more sustainable bottom.
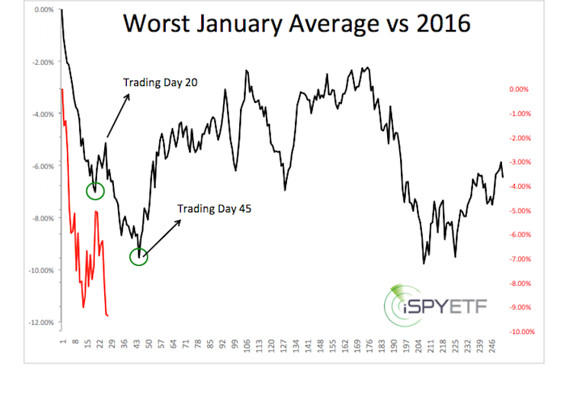
‘Meltdown Pattern’
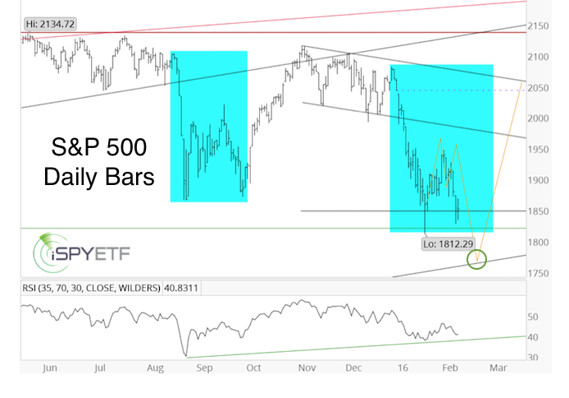
- In 2011, the S&P 500 lost 18% in 12 days.
- In August 2015, the S&P lost 11% in 6 days (see blue box below).
- In 2016, the S&P lost 12% in 14 days.
The 2011/2015 meltdowns were followed by a period of sideways trading and a break/test of the initial panic lows. Based on those patterns (and other pertinent factors, more details below), we projected this path in late January (solid yellow lines in chart below) for the weeks ahead.
 [4]
[4]
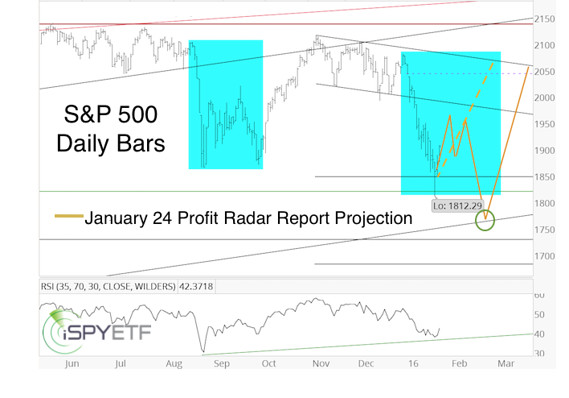
The second chart updates the price action since Jan. 24.
 [5]
[5]
The market has followed the yellow projection very closely thus far. The S&P may continue my projection and head to new lows without bigger detours.
However, the market may also decide to extend the sideways action and whipsaw bulls and bears alike. One way to do so, would be to rally above 1,950, before carving out a more lasting low below 1,800.
The drip-torture market may extend before setting up a bear trap. Although the current decline sports some similarities with 2008, I'm giving a 2008-style decline lower odds (until proven otherwise).
A closer look at the facts, indicators and data points used to compose the above yellow projection (and the most recent projection) is available via this report [6].
Courtesy of marketwatch.com [7]