
Want to know the secret to making a killing trading options? It's not quite what you think.
Ok, maybe to some degree it's exactly what you think – making the right call on a stock or index at the right time. But, if you think there's an end-all, be-all turn-key approach that translates in big-time success, there isn't. The so-called 'trick' is understanding the importance of getting several opinions, and then managing that trade for maximum gain at minimal risk.
Our Grand Slam Options Trading Service [1] just locked in a triple-digit winner on Baidu (BIDU) by walking a fine line with perfection. It's a trade that's worth a post-mortem for traders looking to take their results to the next level.
The short version of a long story: Our Grand Slam service considers a bunch of different indicators at any given time, and all of them have to point in the same direction, so to speak, to turn into a trade. It's a very nuanced art though.
As the sign-up page makes clear, the Grand Slam advisory uses several tools, but primarily looks at Williams %R, CCI (commodity channel index) average, and the Directional Movement Index, or DMI. The first two are technically oscillators, built to spot periods where the chart in question is overbought or oversold, while the DMI indicator is a momentum tool… quite the opposite in most regards. But, in actuality, all three are viewed as momentum tools. See, when a stock or index gets overbought and stays overbought, then it's a sign of hyper-strength that you want to buy into rather than bet against.
The 'trick' is in reading it right.
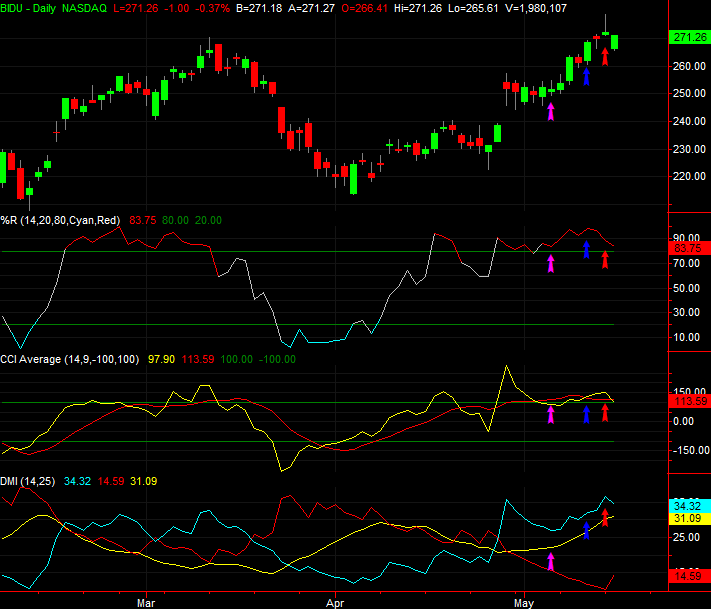
The chart below is a daily look a Baidu shares. The pink arrow is the entry point from May 4th, when we stepped into the Baidu (BIDU) June monthly (06/15) 290 calls (BIDU 180615C290). As you can see, at the time, the %R indicator and the CCI average indicator both suggested BIDU was overbought. But, the rise in the DMI's ADX line – the yellow line in the middle – was on the rise, suggesting the pattern of lows and highs was indeed bullish.
 [2]
[2]
Though we've been able to turn the art into a science by largely objectifying the subjective using TradeStation as our platform, we'll still concede there's an art to it. In this case, the 'art' is recognizing that the Baidu uptrend that had stalled at the time didn't outright break. It just bent. Regular readers of BigTrends commentary will often hear us talk about our 'bend but don't break' rules. This was one of those times we applied the idea with great success. Namely, you can see that the day before we bought the 290 calls at $1.00 per contract, the open/close action was bullish. And, the day of the trade, we saw another higher high and higher low, bolstering the already-bullish DMI indication.
It's complicated, to be sure. Further complicating matters is the fact that on the chart above we're not using the 'normal' Grand Slam advisory settings. The overarching idea still holds though. That is, if we were only using one tool looking for one thing, we probably wouldn't have taken the trade. Good thing we think about more than one thing.
That being said, the real shining star of this trade wasn't the entry, but how we managed the exit. We weren't too quick to get out, knowing the indicators that told us to get in were still intact.
The merits repeating in a slightly different way, so…. we stuck with this trade when others might have bailed on because we saw the CCI average, the DMI lines and the %R indicator were all still signaling bullishly a few days later.
We pulled the plug on half, HALF the trade on May 10th, at a price of $2.00 per contract. That translated into a 100% gain on that portion (and is marked by a blue arrow). We stuck with the second half, though, until the 14th when the calls were trading at $3.00 per contract. That's a 200% gain for that portion of the trade, marked by a red arrow.
Interestingly, though BIDU shares were bumping into new highs on Monday the 14th, we could see the %R and CCI average indicators were starting to wane. That waving red flag ended up being the right call. Baidu was struggling in a big way the next day.
The big 'lesson to be learned' here is two-fold, if not three-fold.
First, you're allowed to use more than one tool at a time, and you don't have to use them conventionally; we've made far more money using tools in unconventional ways. In fact, it's the unusual and unlikely action that often end up being the most trade-worthy.
Second, a huge part of this trade's ultimate success was in how we managed the exit.
By only selling half of it for the 100% gain we had in hand on the 10th, the rest of the trade was essentially a 'free' trade. Even if BIDU had tanked after that, the worst we could have suffered was a break-even. That kind of cushion that lets you be bold is a huge deal. Only about 20% of your trades will turn into monster-sized winners, but you never know which ones are which until you're in. Once you're in, you have to give yourself every possible chance to hit that (no pun intended) grand slam. Scaling out of trades is a big help in that regard.
The third, minor lesson? Keep your eyes on your indicators after you've made your entry using them. It's shocking how many traders stop looking at them altogether once they're in a position even though they can continue to tell you a ton about the chart's actual momentum.
If you'd like to learn more about the Grand Slam trading approach [1] and want to earn as you learn, become a subscriber to the service today. It's more than a little helpful to see how Price picks his trades and then picks his entry and exit points.