
On Monday of this week, the BigTrends Index Options Timer services closed out a big score on a short-term credit spread trade we made on the broad market… using the S&P 500 Index ETF (SPY) as our proxy. Namely, we sold — pocketed a 'credit' upfront — by selling the SPY August week 4 (08/24) 279 puts (SPY 180824P279) last Wednesday (the 15th). At the same time, we also purchased SPY August week 4 (08/24) 278 puts (SPY 180824P278) as something of an insurance policy. But the price we paid for the 278 puts was much less than what the 279 puts added to our portfolio. All told, between the buying and the selling, we booked a credit of 19 cents, or $19 per contract.
Confused about how we're buying and selling and making money upfront with a credit spread? Don't be. The mechanics of option spread trading isn't the focal point just yet. Of most interest to us that we want to pass along to you is why we took on a trade that seemed unlikely to pan out at the time, but ended up translating into a sizeable profit.
As always, getting the right read on the chart is still the most critical part of this game. Everything else is just details.
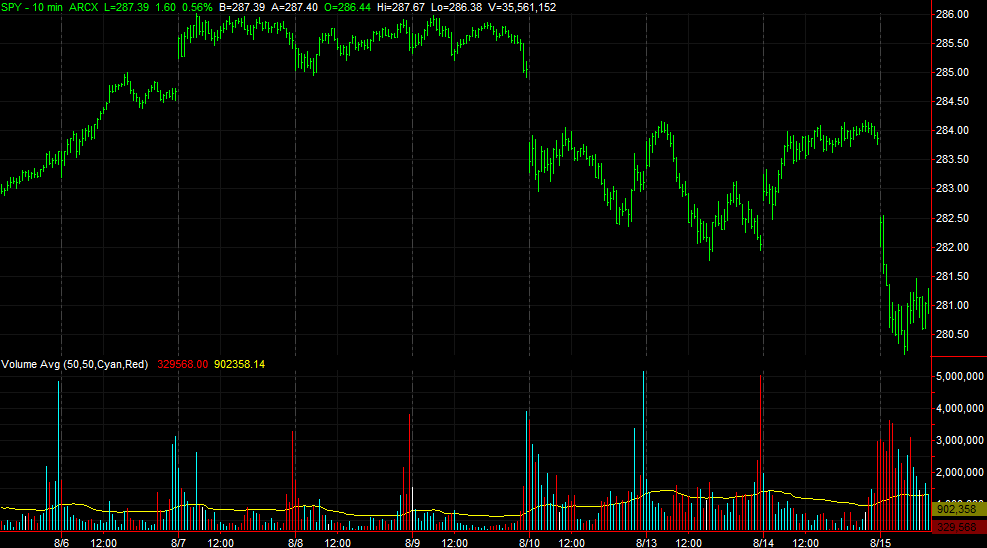
The chart below of a 10-minute chart of the S&P 500 Index ETF, meaning each bar represents 10 minutes worth of time for SPY. It's not a current chart of the fund. The last bar you can see on the far right of the image is "as of" 12:30 pm on the 15th. It's all the information we had to work with at the time, and at the time, the picture wasn't looking terribly bullish. A downtrend appeared to have solidified, and though the ETF had edged a little higher for the couple of hours before we entered the trade, the volume behind that upward move was clearly less than the volume behind the gap-making selloff seen at the beginning of the session.
 [1]
[1]
This is a case where context matter… context that can only be supplied by taking a step back and looking at the daily chart of SPY. Namely, we're looking for where the selloff came from, and how it got here.
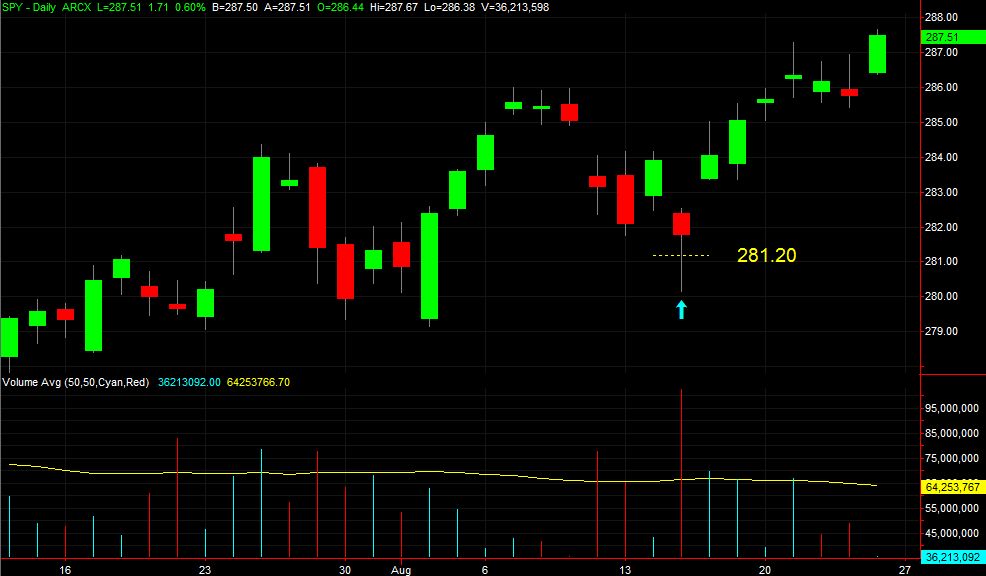
Below is the chart of SPY through today. The arrow marks the bar from August 15th, which was our entry date. The price at the time of entry was $281.20, marked with a dashed, yellow line.
 [2]
[2]
What did we know at the time? Two things stuck out, both of which would have required a look at the daily chart to fully appreciate.
One of them was the volume surge at the time. In just the first hour and a half of that day's action, the SPYders had already dished out more daily volume than they had in weeks. Volume spikes often serve as pivot points, marking the transition from a net-selling to a net-buying environment.
The second big clue was the extent to which the S&P 500 Index ETF has already recovered from its intraday low from that day. It ended up regaining even more of that ground by the time the closing bell rang at 4:00 pm that Wednesday, but even at mid-day when we were getting into our position, the fund was en route to a recovery-minded value.
Also on the daily chart (though it's not plotted on our chart), the daily chart of SPY kissed a rising support line that extended all the way back to May's low. It wouldn't have been evident on most 10-minute charts. That being said, the intraday chart was showing a nice push up and off of a deep low from early that day. It wasn't like we were trying to catch a falling knife while wearing a blindfold.
Whatever the case, what we sold for $19 per contract upfront we bought back for $4, locking in a $15 profit per contract. That was a 17.6% gain on the amount of total capital we put at risk on this trade. (See part-two of this lesson for more on how the math of these trades works.)
The real takeaway for new and even veteran traders is two-fold. One, you can see a lot more when you look at charts of multiple timeframes. Two, you can and should consider more than one indicator, or even one kind of indicator.
If there's a third takeaway, it's this… as systematic as we try to be, this is a case where a judgment call had to be made. Based on the severity of the early plunge, the flood of selling volume that came with it, and the subsequent bounceback that got following just an hour and a half later, we felt comfortable enough to pull the trigger. Though you should be methodical and systematic in your trade-selection approach, trading tools are just that – a tool. Clear-headed thinking and self-discipline are still a trader's most potent weapons.
That being said….
This was a risky trade, or at least would have been had we only sold — or shorted — the SPY August week 4 (08/24) 279 puts (SPY 180824P279). Truth be told, we probably wouldn't have taken on a true naked short position here. It was ownership of the SPY August week 4 (08/24) 278 puts (SPY 180824P278) that gave us just enough downside protection that let us take a shot on the bounce from the broad market that did indeed end up materializing… a shot that was taken on an admittedly less-than-perfect setup on our chart.
That points to the importance of being able to use different kinds of option trades for different kinds of setups. The charts above wouldn't have been well suited for an outright purchase of a call option. But, it was ideal for a credit spread using put options.
If you want to know why, here's part-two of this look is right here [3].