What's the key to becoming a truly great option trader? Obviously being able to spot the true trend of a stock or index is critical, but plenty of people can do that without necessarily turning that skill into rip-roaring gains. The other critical component of doing well in this business is using the optimal calls and puts in the first place.
Spoiler alert: Neither the cheapest nor the highest-delta options are necessarily the top choice all the time. The type of trade you're taking on and your targeted timeframe play a role in making trade selections too. And, the only way to really weigh your choices properly is with a matrix that easily compares them all.
Let's take a deeper dive into the idea using one of our recent option trade alerts issued by the Options Swing Trader advisory.
The alert was issued back on Friday, March 26th, suggesting to subscribers they buy the Verizon (VZ) April monthly 54 call (VZ 210416C54) expiring on April 16th at a price of $4.20 or less, or $420 per contract.
The option-selection process actually starts here.
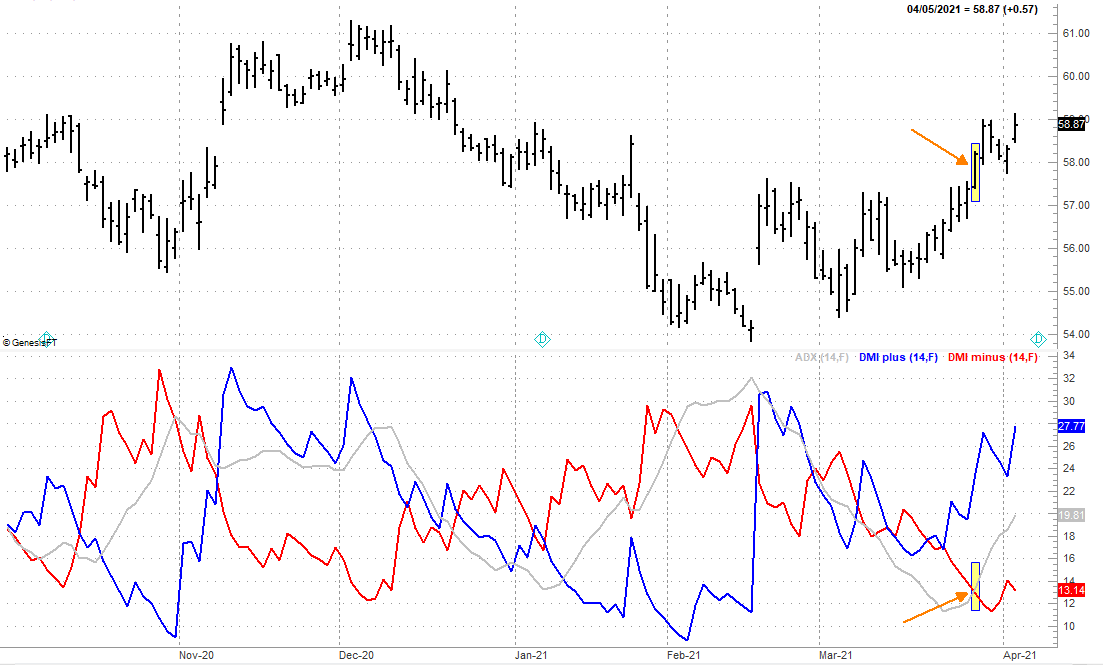
The underlying algorithm that helps us spot well-suited setup for our Option Swing Trader relies heavily on the directional movement index (DMI) lines, and more importantly, the average directional index (ADX) line the DMI lines co-create. This is a powerful indicator, but not necessarily for all types of trades. The DMI/ADX lines are well-suited for use with daily charts more so than other tools may be, and our application of them is designed with a holding period of a week to two weeks. Anything more or anything less, and we'd be better served using other indicators. Here's what the DMI and ADX lines looked like at the entry point. As you can see, the ADX line had started to move higher in step with a rebounding Verizon stock chart. Specifically, this ADX line has pushed above the DMI- line plotted in red. That's a key clue.
 [1]
[1]
Perhaps most important of all, the Option Swing Trader service is meant to be a lower-risk advisory. Yes, that impacts which options we choose to trade, but it also means we only use a relatively limited universe of stocks to trade. We're looking for less volatile names like Verizon, but we're also looking for plenty of predictable liquidity… the stock, and the options.
But what does this mean when it comes time to put the signal to use with an actual option trade? Let's go back to that day.
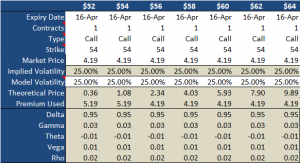
The table below is a look at the pricing matrix of all the prospective call options we could have chosen that day. The expiration was always going to be April 16th, as that's about how far out the ADX/DMI lines help us handicap a daily chart's action. And, for risk-management purposes we'll go fishing for 50% gains while allowing a 20% downside before a stop-loss kicks in. Finally, experience has taught us that for this particular system and the stocks we use within our Option Swing Trader newsletter's universe, a price range of between $3.00 and $8.00 is optimal. With these parameters in mind, our choices were defined to these seven closely-related possibilities. The only aspects of the trade we could control (aside from the one we picked) were the strike price, and the market price of those calls. Everything else was already decided for us.
 [2]
[2]
Of course, that doesn't answer the question: How did we choose among these seven options? The key is plugging in the what-if numbers to see which of these choices will give us close to a gain of 50% on the upside, but no worse than a 20% downside if we have to bail out. To do that, we have to plug in all the pricing possibilities for these options based in the best-case and worst-case scenario for each call option.
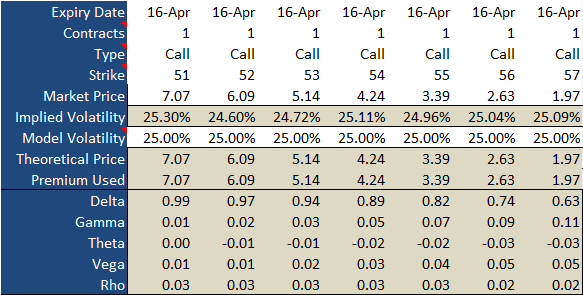
Don't worry. We're not going to do that here. Instead we'll just show you all the different values for the 54 calls with Verizon priced at different levels about a week after our entry. [The column headers now indicate the price of Verizon shares, while the “theoretical price” line indicates what the 54 calls would be priced at if-and-when Verizon shares move to that level.]
 [3]
[3]
Given this new matrix, a $4.20 investment in Verizon's 54 calls back on March 26th when shares are valued at $58.18 would be worth around $5.93 a week later if Verizon shares can move to $60. That's a 41% gain on the option based on a $1.82 gain for the stock. Conversely, the $4.20 we spent on the 54 calls on March 26th would only be worth $2.34 per contract were Verizon to slide back to $56 per share a few days later. That's a 44% loss, though as we noted, we'd bail out when the loss got to around 20%. Verizon would be closer to $59 at that point.
Yes, it's a bit of work, although the more you do it the better of a feel you get for the process so you don't have to do it. Understanding all the Greeks at the bottom of the table also helps enormously.
The big take-away here, though, is the fact that you really have to understand how well your chosen indicator works for your timeframe, and how well your indicator works for certain stocks. The ADX/DMI tool may not work as well for intraday or weekly charts, or for a more explosive and unpredictable ticker like Tesla (TSLA), which tends to pump up theta (time decay) as well as option premiums… the value of an option above and beyond its intrinsic value. Trading options on those stocks requires paying closer attention to measures like gamma. Option credit spreads require a completely different selection process, like lower deltas and higher thetas.
Perhaps most of all, picking the ideal option means you have to have some sort of price target in mind, which goes back to your indicator and/or a visual read of your chart. We're now up about 20% on our Verizon calls, but it looks like there may be something about the $59.00 level getting in the way. Shares are hitting a ceiling there now like they did back in January.