– There are similarities between today and the year 2000, when stocks topped out –
By Simon Maierhofer, MarketWatch [1]
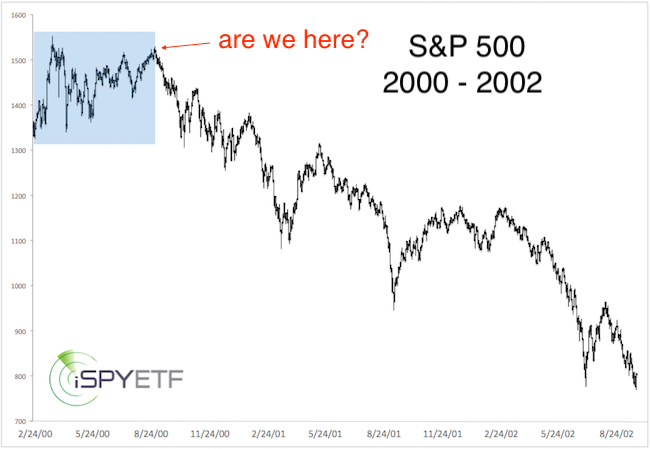
If you are up for a pattern-recognition test, take a look at the top (blue) half of the chart, below.
What's shown is a seven-month correction from an all-time high.
When did this correction happen?
 [2]
[2]
It looks a lot like the S&P 500 Index in 2018, right?
Wrong! The 2018 correction (Dec. 26, 2017, to July 10, 2018) is shown in the lower graph.
The top graph reflects the initial pullback from the 2000 all-time high.
Those two periods – 2000 and 2018 – look eerily similar.
As the second chart shows, the pullback from the 2000 all-time high turned into a full-fledged bear market.
 [3]
[3]
Will 2018 follow the 2000 crash pattern?
Here is a look at various indicators to determine the current "crash risk."
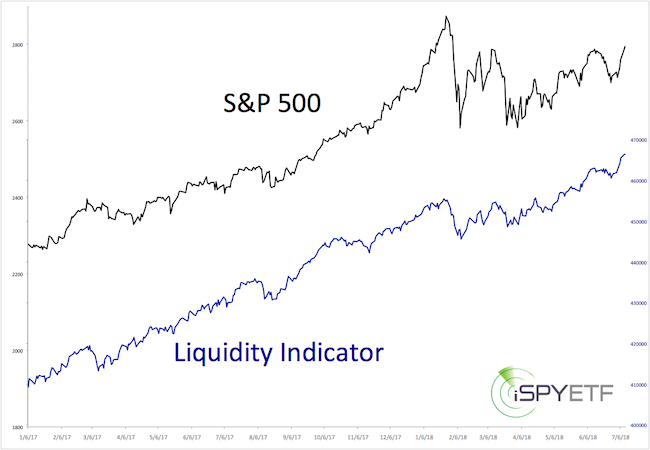
Liquidity
Liquidity, or money flow, is the lifeblood of the stock market. If stocks rise on slowing liquidity, it's generally bearish. That's what happened in 2000.
In fact, my favorite liquidity indicator showed signs of deterioration months before the 2000 market top. (This is called a bearish divergence.)
The bearish divergences occurred before the 1987 and 2007 tops. Charts with an explanation of the liquidity indicator, and how it behaved prior to the 1987, 2000 and 2007 tops, are available here.
This lack of liquidity caused a fractured market, where the Dow Jones Industrial Average topped Jan. 14, 2000, the Nasdaq Composite and Russell 2000 on March 10, and the S&P 500 and Nasdaq 100 on March 24.
In 2018, the S&P 500, Dow Jones Industrial Average and Nasdaq all peaked on the same day (Jan. 26), and the Nasdaq, Russell 2000 and liquidity indicator have already hit new all-time highs (see chart).
 [4]
[4]
Seasonality
The Profit Radar Report's 2018 S&P 500 forecast said that the index tends to drop 14.4% in the mid-election year. The 2018 mid-election year drop was 11.8% (so far).
More importantly, from the mid-election year low to the pre-election year (2019) high, the S&P 500 tends to rally 36.8% (more details about this pattern available here [5]).
Unlike 2018, 2000 was not a mid-election year. Seasonality favors rising prices into 2019, not a 2000-like crash.
Conclusion
Liquidity, seasonality and momentum (not discussed in this article) do not point toward a 2000-like crash. In fact, they all point higher by the end of 2018.
A more short-term-oriented S&P 500 forecast is available here: S&P 500 outlook [6].
Simon Maierhofer is the founder of iSPYETF [7] and publisher of the Profit Radar Report. He has appeared on CNBC and FOX News, and has been published in the Wall Street Journal, Barron's, Forbes, Investors Business Daily and USA Today.
From MarketWatch [1]