– Elliott Wave theory suggests stocks could extend gains if the S&P 500 breaks through 2,915 points –
By Avi Gilburt, MarketWatch [1]
In fall 2018, when I was warning about a 20%-30% correction I foresaw in the stock market, I also warned that within that "correction," the market could make a new all-time high.
It may still do so, with this week giving us indications regarding those probabilities. Allow me to explain.
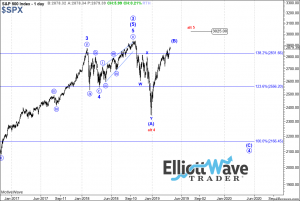
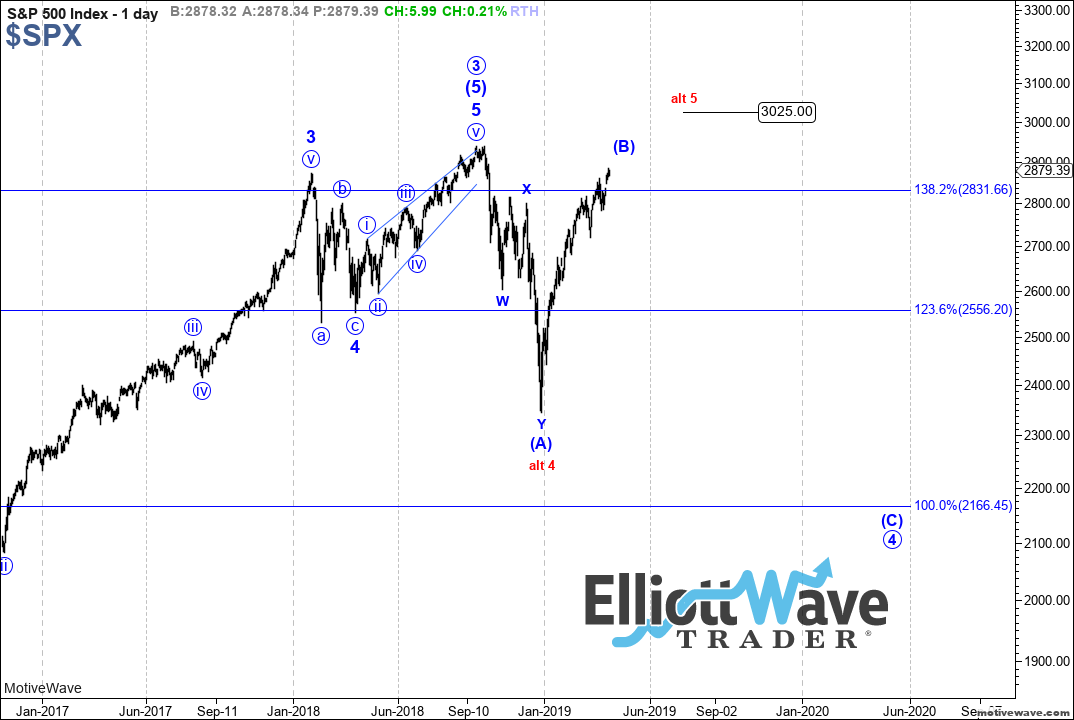
Over the past few weeks, as stocks have been approaching my target for this b-wave rally, my expectation was that the S&P 500 Index was going to top out in the 2,865-2,885-point region and turn down for the c-wave. However, the manner in which stocks have risen to this target suggests that this rally may have more legs to it than I initially expected in February, when I set this target.
But if we go back before February, I had maintained some expectation that this b-wave rally could even make a higher high in the 3,011-3,040 region. You see, the wave 3, which topped in September, had an ideal target of 3,011. And when a 3rd wave fails to strike its ideal target (we came up about 70 points short), we often see the b-wave of the ensuing correction strike the target before turning down in the c-wave of that correction. That was the reasoning I had many months ago about why this b-wave could have potential to rally to that higher target.
 [2]
[2]
However, due to the overlapping structure we saw in February, along with the lack of pullback, I modified my target for this b-wave down to the 2,865-2885 region. Yet, as I highlighted in my Wednesday update, the manner in which we have now approached this modified target has developed a structure that can still take stocks up to the 3,011-3,040 region. So, unfortunately, I have to abide by the words purportedly stated by John Maynard Keynes: "When my information changes, I alter my conclusions. What do you do, sir?" So I apologize for the revised perspective, but I wanted to introduce it before it happened rather than after the fact.
So the structure has now opened the door back toward my initial thoughts of many months ago that this b-wave rally may still attempt to strike the levels that the 3rd wave failed to within the 3,011-3,040 level. But the market has to break through the 2,915 level to suggest this is the case.
Please make no mistake about the fact that we are now within a region that can turn us down strongly for a b-wave top. We have enough waves in place to consider the b-wave rally we have been tracking as truly completed. So, yes, we have reached another inflection point for the market. But the market will have to break down below 2,845 to begin to signal we have finally completed this three-month-long b-wave rally.
In summary, the market is now at an inflection point. As long as it remains below 2,915, there is enough of a structure in place for stocks to top out in a b-wave rally. And, should stocks break down below 2,845, that will start turning the probabilities back toward the potential that the b-wave has completed, and we will begin to track the setup that can take us down as low as 2,200 in the coming months. However, if the market is able to push through the 2,915 region, then it suggests stocks can rally as high as the 3,011-3,040 region, and I believe small-cap stocks will lead that segment of the rally.
Lastly, I want to reiterate that I think that this rally is still primarily a b-wave for all the same reasons I have outlined many times before. In fact, Bayesian probabilities are now calculated for it to be a 75% likelihood that this rally is a b-wave, even if we do go higher. That means whether it happens here or from a higher level, the bigger patterns suggest we can still revisit the 2018 lows, and may even break below them before the next major bull phase takes us to 3,500-4,000 into the years 2022/2023. At this time, this will seem like an impossibility to most. Well, I heard the same thing when I noted we can see a 20% drop from the 2,900 region last year.
View additional charts illustrating Avi's wave counts on the S&P 500 across various time frames.
Avi Gilburt is a widely followed Elliott Wave technical analyst and founder of ElliottWaveTrader.net, a live trading room featuring his intraday market analysis (including emini S&P 500, metals, oil, USD & VXX), interactive member-analyst forum, and detailed library of Elliott Wave education.
From MarketWatch [1]