
Weakness has continued into September, but what's next?
"This is not one of my favorites right now." That is what Jim Cramer had to say about Netflix Inc. (NFLX [1]) to one caller during the Lightning Round of Mad Money Thursday night [2]. After that huge downside gap in July it is no surprise but let's see what the charts look like now.
In the daily bar chart of NFLX, below, we can see that after the gap lower prices made a short rebound rally to the underside of the declining 200-day moving average line. The weakness has continued into September with the 50-day moving average line falling below the 200-day line for a dead or death cross.
The On-Balance-Volume (OBV) line has been weak telling us that sellers have been more aggressive. The trend-following Moving Average Convergence Divergence (MACD) oscillator has slowly turned up for a cover shorts buy signal.
In the weekly bar chart of NFLX, below, we can see what looks like a large top formation going back to early 2018. Prices are below the flat 40-week moving average line.
The weekly OBV line is bearish and confirming the decline. The MACD oscillator is in a sell configuration below the zero line.
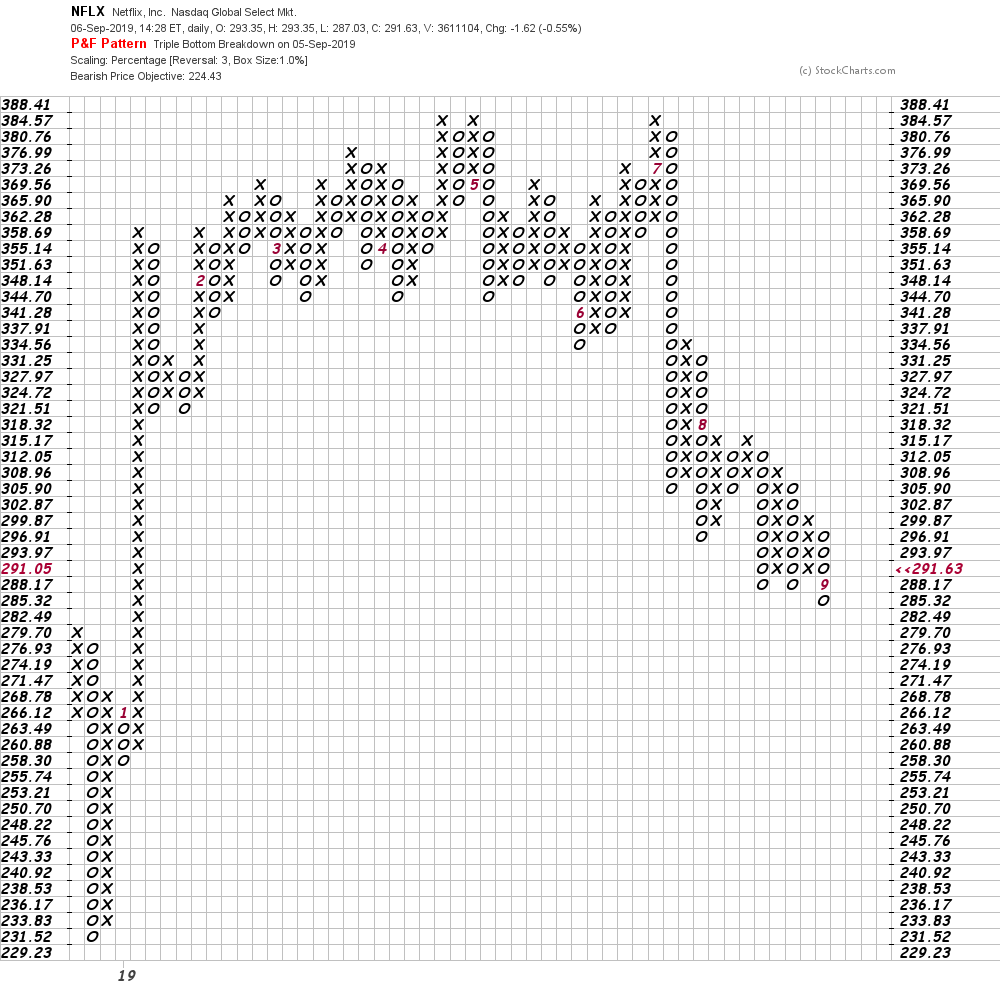
In this Point and Figure chart of NFLX, below, we can see a potential downside price target of $224 being projected. This chart will probably need a rally over $300 to turn it neutral.
Bottom-line strategy: NFLX could stage an oversold bounce but without any basing action I would suggest we will see further declines in the weeks and months ahead. Avoid.