
If it seems like the market is trying to frustrate you by making it impossible to handicap, that's because it is.
That certainly didn't change with Monday's action, when a little bit of trade war news was enough to pull the rug out from underneath the market and let it slide below the key 200-day moving average line. It's the first time the S&P 500 has been below the long-term moving an average in months.
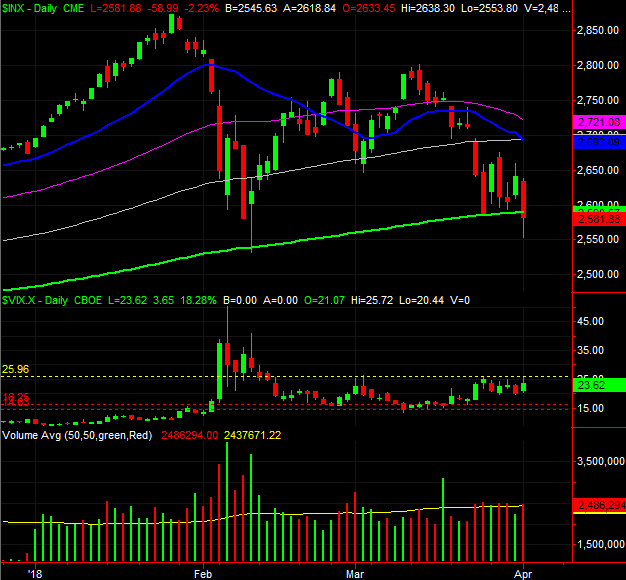
It wasn't a decisive blow, though it looked like it was around mid-day. When all was said and done the S&P 500's close of 2581 was better than its low of 2553, but that was still less than the 200-day line's current reading of 2590.
Yet, there was just enough of a glimmer of hope by the end of the day to prevent would-be bears from piling on.
Take a look. The index bounced back just a little bit late in the session. It's also curious that despite the market's extreme weakness, the VIX didn't hurdle its recent ceiling at 26.0. The S&P 500's volatility index will need to move above that level first if marketwide weakness is to turn into a full-blown correction.
 [1]
[1]
That's not to say it won't happen in the future. It might happen. Or it might not. That's the problem… we're still very much on the fence.
Whatever the case is, clearly the market is on the defensive here, being pounded around by the sellers with the bulls unable to do much about it.
There's another red flag quietly waving in the background. That's the market's volume. As you'll also see on the chart above, the red volume bears have been a little bit – if not a lot – taller than the green, bullish volume bars of late. That's still the case as of Monday's session.
Yes, this is confusing. It's not an accident though. The market is meant to confuse you, convincing you a breakdown is looming when a rebound is actually around the corner. Likewise, the market (or at least its participants) likes to tease you with bullishness right before it implodes. Right now, it's not dropping any hints – false or otherwise – largely because it's trying to get more people confused. Give it time. Don't take the bait the chart is waving in front of you. Wait for more clarity.
That said, don't ignore the reality that the undertow is bearish, even if it doesn't feel like it is every single day. The 20-day moving average line (blue) just fell under the 100-day moving average line (gray), and even if the S&P 500 manages to rally out of trouble here, those other moving average lines are poised to step in as a technical ceiling.
The big signal? That's actually going to be the VIX. Look for a trend above 26.0, though bear in mind a big surge from the VIX – maybe above 40 – will also signal a hard bottom for the market rather than the beginning of a prolonged pullback. The S&P 500 will likely be in a freefall that day, which will look and feel scary at the time, but will end up being a capitulation.
If the market is going to make a meaningful selloff here (as in on the order of 10%), it's going to need be a well-paced move… something the market hasn't been good at in a long, long while. Traders are trading on their emotions, ignoring fundamentals that don't align with their pre-conceived notions, and over-reacting to every headline.
Your best move here is simply recognizing that's what's going on, and keeping your powder dry waiting on better risk/reward options.