
It's been a while since we've taken a look at the relative performances of each major sector. There's been little need to do so. December's rout was punishing across the board, and the January bounce was equally bullish for all groups. In other words, it's been impossible in recent weeks to identify where the market's hot spots and cold spots are.
With the dust finally settling though, the leaders and laggards are finally starting to diverge. And, it's the recent market weakness – perhaps tepidness would be a better word – that's allowing it to happen. Some surprising names are moving to the front of the pack.
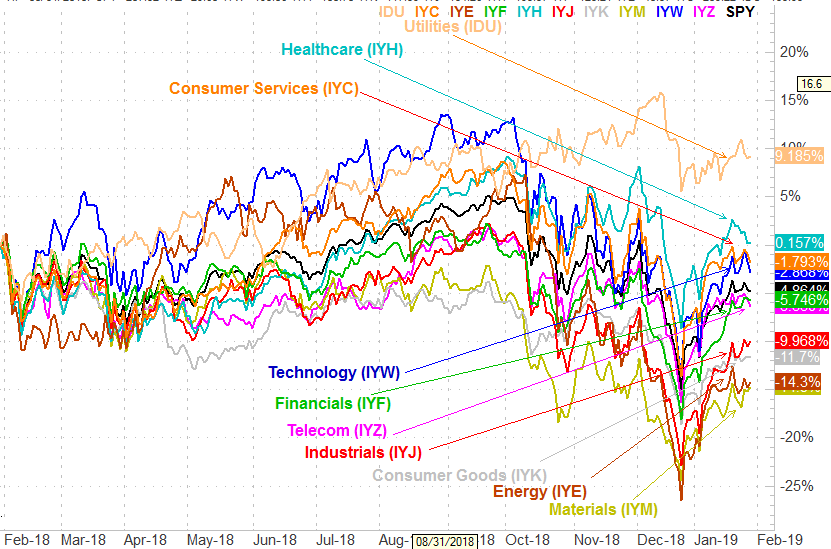
Sector Rotation Analysis
It's a point we repeatedly make, but it bears saying again now: Yesterday's losers are tomorrow's winners, and vice versa.
We don't mean a literal day (though the premise can still apply literally to one day's action). We mostly mean that leaders don't lead forever, and laggards don't lag forever. The market's key industry groupings are forever moving to and from the top of the performance pile. If you can catch one of those swings, you can often squeeze out some 'alpha' that you may not have otherwise been able to tap into.
With that as the backdrop, it's noteworthy but not surprising that the sectors overcoming the lethargy that took shape last week were three of the biggest losers headed into the December bottom. In fact, materials, energy and industrial stocks lost the most ground between September and December, but they've shrugged off the tepidness since last week and continue to edge higher.
 [1]
[1]
It's not high-flyin' leadership, to be clear. Those three sectors and the ETFs we're using as sector proxies are still struggling against the headwind. But, they're not losing ground the way most other groups are. This means they're better positioned to lead should things not change.
Bolstering the bullish argument is that these three groups were long-term laggards, and may be ready to reclaim the ground they didn't entirely deserve to lose.
At the other end of the spectrum, healthcare, technology and telecom stocks seem to be struggling more than other sectors are, even though they largely led the rebound since late September.
It's still a bit soon to draw sweeping conclusions, and this sort of analysis is never definitive in and of itself. As we saw last month and this month, a strong move from the market in either direction is going to push all sectors along with it.
But, in less abnormal environments, some groups can and often do make gains at other groups' expense. What we see taking shape right now may be a subtle hint of how that rotation will treat certain sectors. This analysis, coupled with other trading tools, can help identify the best of the best trends; think of it as a second opinion.
Looking Ahead
The real test, and clues, have yet to come. Let's see what this performance-comparison chart looks like when the market rebounds or breaks down. Namely, we're going to be looking for crossovers of each of these lines.
If a trend is well developed enough to surpass the performance of another sector's performance (or if underperformance drags one of these lines below another), that's often a sign that a trend has developed legs and may be worth plugging into.