– Decline merely takes market cap back to December level –
By Ryan Vlastelica, MarketWatch [1]
The sharp selloff in the U.S. stock market may feel like a gut punch to investors who have gotten used to steady gains and low volatility, but the move lower isn't so extreme when put into context.
The drop on Monday represented the largest one-day point drop for the Dow Jones Industrial Average ever, as well as the blue-chip average's biggest percentage decline since August 2011. Both the S&P 500 and the Nasdaq also suffered sharp drops, and it ended a historic streak of the market going without a 5% decline. However, it wasn't as unprecedented as those statistics make it sound.
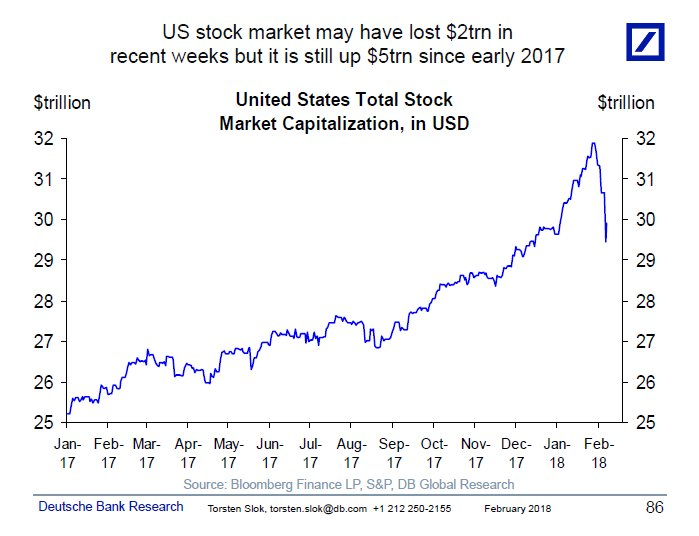
"Seen over a longer period, the correction in the stock [market] is relatively small and is likely to have no impact on the macro economy," wrote Torsten Slok, chief international economist at Deutsche Bank. He noted that while a hefty $2 trillion was erased from equity market capitalization, it remains up $5 trillion from early 2017.
In fact, the recent merely pared the market cap-which stands above $29 trillion-to a level last seen in December.
 [2]
[2]
Courtesy Deutsche Bank Securities
While Wall Street has recovered modestly from the lows of earlier this week, it remains solidly below its record levels, hit in late January. However, the market has historically rebounded from 4% drops, as both the Dow and the S&P recorded on Monday. According to the WSJ Market Data Group, the S&P 500-when looking out three months after a 4% decline-is historically up an average of 6.11%, enough to erase the loss. It is positive 56% of the time over such time periods.
From MarketWatch [1]