It's here. Q2's earnings season, that is. Although Alcoa (AA) has yet to post its most recent numbers, a whole slew of big banks reported their second quarter results this past week. There's not going to be any time in the near future where investors can stop watching earnings news, as those reports will push the market around… for better or worse.
Broadly speaking, the bar's set pretty high, though there's no reason to think corporate America won't get the job done all the same; tax cuts help. Standard & Poor's says the S&P 500 is projected to post a profit of $38.68 "per share" for the second quarter of this year, up 26.7% year-over-year.
That's a huge improvement, leading investors to ask one big question: How exactly is the broad market going to do that?
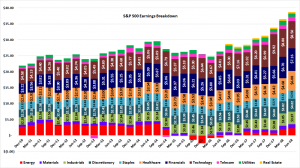
There's an answer to the question, by the way. A pretty detailed answer, in fact. And as usual, a picture helps tell the story far better than mere words can.
The graphic below is a breakdown of how each major sector contributed to the S&P 500's total earnings going all the way back to late-2010. The most recent look – the 2nd quarter of 2018 – is just based on current estimates, but those estimates are usually on target. It's not surprising to see that the technology sector has been and continues to be the market's biggest earnings contributor. What's largely been overlooked about the earnings season underway, however, is how big of a leap the financial sector's bottom line is expected to get for the second quarter. Higher interest rates in conjunction with a brisk economy are the underpinnings for that progress.
If the overall market is going to have a good or bad earnings season, it's mostly going to rely on those two groups.
 [1]
[1]
There are some other interesting take-aways from the graphic though. One of them is the fact that the energy sector continues to improve the bottom line on the heels of higher oil prices. Yet, we're still only about half as strong (profit-wise) as we were back in 2014, before the meltdown.
Also noteworthy, and only evident with a look at the above image, is how reliable the industrial and discretionary sectors have been in terms of creating profits.
Almost all sectors have been and will continue to grow their bottom lines, to be clear. Only three sectors could really make or break the broad market though. And, for better or worse, not only is the technology sector the heavy-hitter, a small number of stocks wield an enormous amount of influence on the whole sector's total profitability…
… not that we all didn't innately know that.
It's not information that you necessarily need to "do" anything with, now or later. It is something you'll want to keep tucked away in the back of mind as we progress through earnings season. While other traders are reacting hysterically to each and every different earnings report, you'll be able to think in bigger-picture, more philosophical terms. Keeping a level head is half the battle of this game.
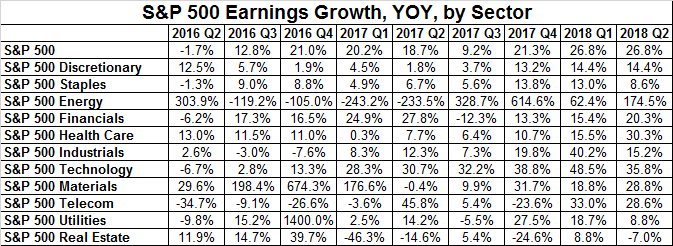
We'll be drilling deeper into sector-specific fundamental data in the near future, but the foundation for that analysis starts with the chart above. It puts all of it into perspective. Just to whet your appetite though (and put some specific numbers into your processing of the data), here's how each sector's earnings have been or continue to change.
 [2]
[2]