As far as breakouts go, it wasn't exactly ideal. The market doesn't like to leave gaps in the rear view mirror, and the one left behind with Wednesday's leap is difficult to ignore. Nevertheless, gold has punched through a major ceiling, and did so without the help of a plunging dollar. Though it will be difficult for gold futures to keep on rallying without some sort of pullback (one's already started, in fact), a big part of the job has just been done.
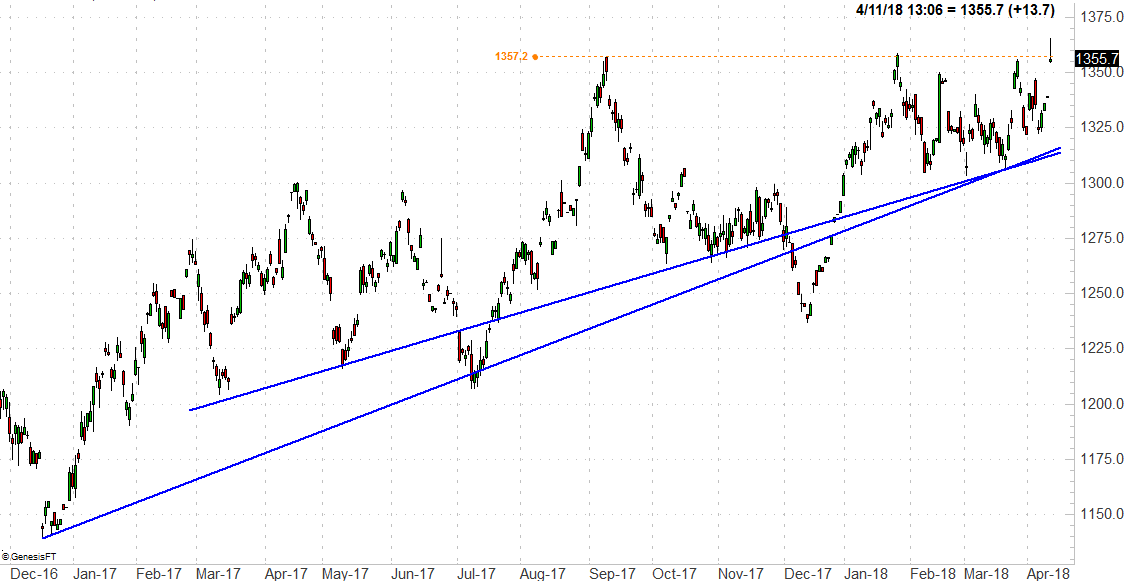
The daily chart of gold futures below tells the tale. Gold has been pressured higher by a couple of different rising support lines (blue) going all the way back to late-2016. Not perfectly, but observably. At the same time, since the September peak from last year, the $1357 area has been something of a ceiling. Not anymore though. With Wednesday's push, gold has proven it can get above that key line in the sand.
 [1]
[1]
It's not yet proven is can stay above that level, however.
It's not the kind of bullish thrust you would want to see if you had the choice. Tuesday's high of $1339 and today's low of $1354 leaves behind a big chunk of real estate nobody from either side of the table can stand to see remain unfilled. Indeed, on an intraday basis Wednesday's action is already working to close the gap.
Just because gold is looking to fill a gap doesn't mean it has to continue moving in that direction though. Volatility is the norm here, and now that gold futures have broken their resistance line, the next effort to cross back above it becomes a much easier one… one that might last, and one that will likely unfurl at a more sustainable pace.
There's more to this than just the move above $1357 though, temporary is it may be.
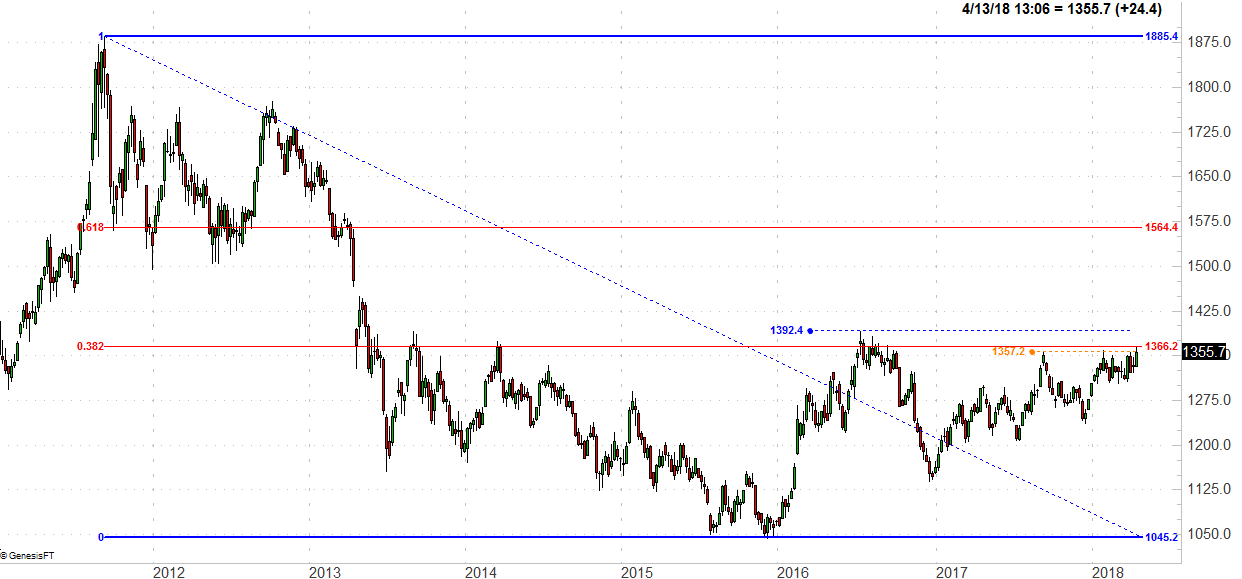
The short explanation of Fibonacci lines: They provide a trading framework, largely rooted in psychology, for when there is no other trading framework to reference. Charts tend to retrace previous moves in very specific increments… 38.2% retracements and 61.8% retracements, to be exact. Those figures are based on mathematician Fibonacci's discovery.
Care to guess what Wednesday's high has been? $1365, which for all intents and purposes is a 38.2% retracement of gold's pullback from the 2011 high of $1885 to 2016's low of $1045. It's not likely to be a coincidence.
 [2]
[2]
It's a potential blessing and a potential curse, though right now it's neither.
It's a blessing in the sense that if and when gold futures get and stay above $1366, it'll be a strong sign that the new effective trading range will be above $1366 (though below $1564). It's a curse in the sense that clearing Fibonacci lines isn't easy. If gold peters around here for a few days and is allowed to drift more bearishly than bullishly, it's a good sign that a gold breakout just isn't going to happen – at least not with this particular effort. It may have to hit the "reset" button, which postpones any breakout for a few weeks and lets the commodity slide back a fair amount.
For the time being though, we're mostly on the fence.
Broadly speaking we're gold bulls here, though largely because we think the U.S. dollar is going to weaken. As was noted, the U.S. dollar didn't crater today. Gold's surge is more about politics, and subsequently, inflation. Given enough time though, gold and the greenback measurably move in opposition to one another.
Even if the dollar doesn't tank though, gold CAN still edge higher. Inflation, or at least inflation fears, are enough to light a fire under gold futures, and there's no denying inflation is increasingly a concern at this time.
Just sit tight for now. This could take a few days to really take a meaningful, trade-worthy shape. Be sure to put the premise on your radar though, if for no other reason that the stronger gold is, the more it works against stocks and bonds.