The U.S. Dollar is Testing the Waters of a Rebound. It'll Change Everything.
After months of selling stemming from the advent of the pandemic, the U.S. dollar may be close to a recovery. The U.S. Dollar Index is back above all of its key moving average lines, and those lines themselves are have dished out some bullish crossovers (and others are about to do the same). We're also within reach of the first higher major high since early 2020, and we've already logged the first higher low since then. If these clues pan out as expected, the greenback could move into a new full-blown uptrend.
If that happens, a bunch of different market components could take on a new direction.
But, first things first... the daily chart of the dollar index. Take a look. The 20-day moving average line (blue) has crossed above the 200-day moving average line (green) as of late last week after crossing above the 100-day moving average line (gray) just a few days earlier. The 100-day average is close to moving above the 200-day line as well, which will further cement the bullish reversal effort into place.

Also notice the chart of the U.S. Dollar Index itself. The pullback was halted pretty firmly back in January, and though the bears took another swipe in April and May following the Q1 recovery effort, the bulls held their ground again. End result? The index has at least broken out of its bearish mode.
As for what this means for other areas of the market, buckle up.
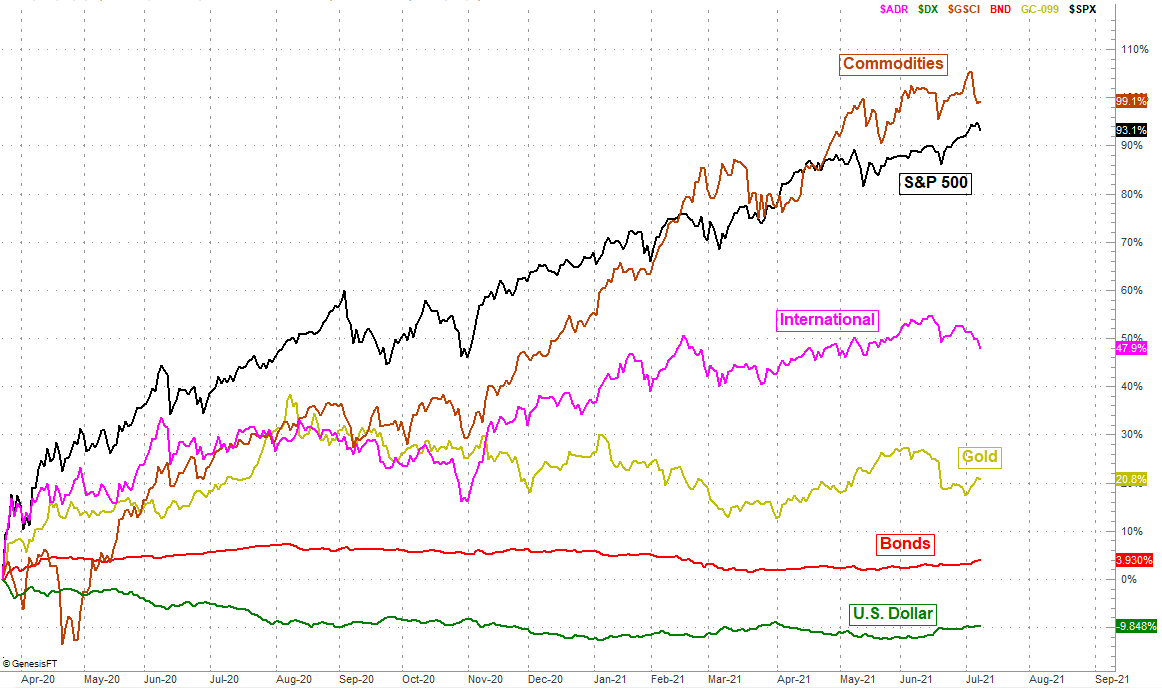
First and foremost, for American shareholders of foreign equities, this is particularly bad news. These stocks have been subpar performers of late anyway, but the rebounding dollar only works against these stocks to an even greater degree. This is also generally bad news for gold prices, although strangely enough, gold's lagged of late... when it arguably shouldn't have. (This may be a hint the use of gold as a hedge has become a greatly-overcrowded trade, and no longer "works" in this way.) In the same vein as gold but to a much greater degree, a rebounding dollar poses problems for the already-overbought commodities category. It's also bad for bonds... theoretically. Just take that idea with a grain of salt, as bond prices themselves have gotten a little squirrelly as traders speculate about the future of interest rates, which is ultimately a speculation about inflation. The inverse relationship may be more uncoupled right now than it seems.
There's one category represented on the graphic above that we didn't talk about... U.S. stocks, as represented by the S&P 500. That wasn't an error of omission. It's just that this is the one group least affected by the prospective rebound of the U.S. dollar. Be careful not to speculate too much with these equities based on currency value fluctuations alone. Instead, stay focused on the usual things that tell you where major indices are headed.
Of course, none of this matters if the U.S. Dollar Index doesn't make good on its apparent reversal effort. This isn't a terribly big concern here, however, for one big reason.
Take another close look at the daily chart of the dollar index again... the one with all the moving average lines. In fact, pay particularly close attention to the moving average lines themselves. Notice how they're all converging again after diverging around the middle of last year? This is a big deal. Such a convergence is often a sign of a whole new paradigm for the underlying instrument. In other words, it's a clue of a major change in momentum and not just a little volatility. In this case the big change is a transition from a bearish mode to a bullish one.
Clearly nothing is ever etched in stone. Given the clues though, it wouldn't be wrong to start adjusting portfolio mixes to factor in the likelihood of the U.S. dollar's continued recovery.