
Stocks might have ended last week on a high note, but they didn't start the need week off on a bullish foot. The S&P 500 fell 1.04% on Monday, and the NASDAQ Composite was routed to the tune of 2.55%.
Here's the kicker… every single FANG stock lost more ground than the NASDAQ did. This particularly poor/bearish leadership on behalf of the market's tone-setters speaks volumes.
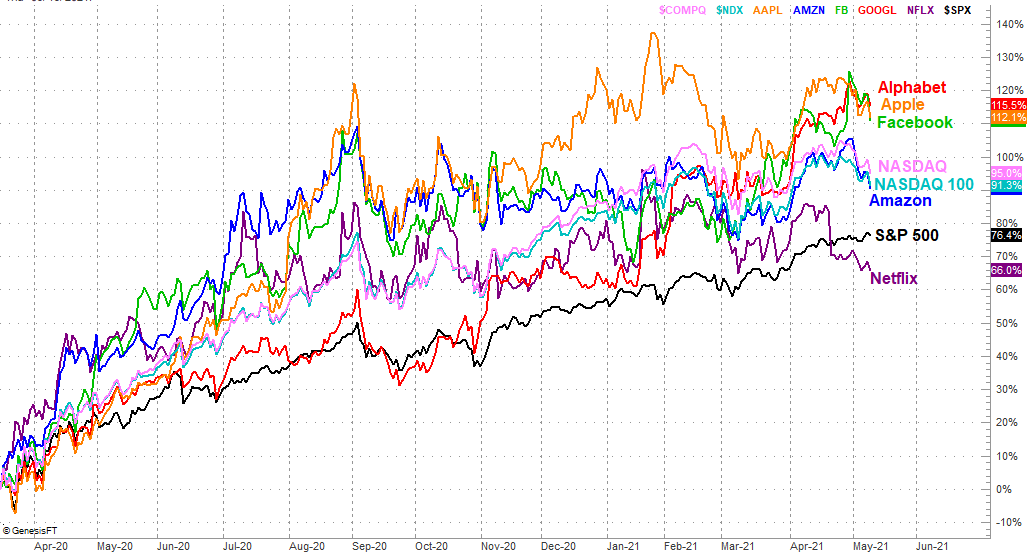
The performance comparison graphic below speaks for itself. Netflix (NFLX) has been lagging for months, but is firmly below the S&P 500's performance since the market bottom made in the middle of March of last year. Amazon (AMZN) is now lagging the NASDAQ Composite and the NASDAQ 100 for that same 14-month stretch. Alphabet (GOOG, GOOGL), Facebook (FB), and Apple (AAPL) are all three still better performers for the timeframe in question, but again, all three fell more than the composite did on Monday.
 [1]
[1]
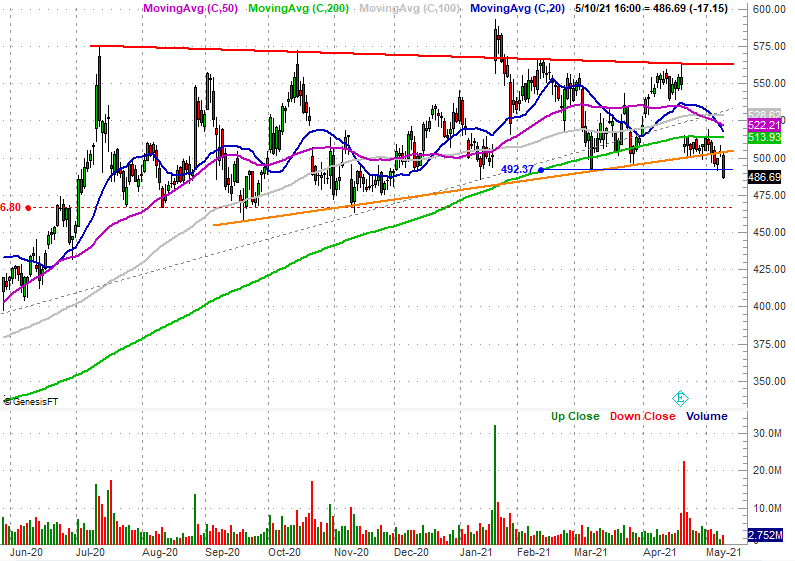
That relative weakness from Amazon and Netflix is no small matter either. In both cases Monday's selloffs dragged those respective stocks to or below critical support levels.
For Netflix, the line in question is $492.37, marked in blue on our chart below. Shares had already broken below the lower edge of a narrowing trading range framed in orange last week, and moved under the 200-day moving average line (green) last month, and that line appears to have turned into a technical ceiling with Netflix shares tried to push up and off the lower boundary of the long-term trading range. The move below $492.37 wasn't a long trip to make.
 [2]
[2]
Amazon shares aren't in the same degree of trouble… for the most part. Monday's pullback dragged the stock all the way back to the convergence of the 200, 100 and 50-day moving average lines (green, gray, and purple, respectively), but didn't pull AMZN shares under that floor at $3218. That's bullish. But, it's problematic in the sense that one more misstep could simultaneously pull the stock below three well-watched moving average lines. A move under any of them could trigger more technical selling.
 [3]
[3]
None of the other FANG stocks are at or even near major technical turning points, thanks to their continued bullishness through last month. That doesn't make them any less vulnerable to profit-taking here, however. It just means there's no make-or-break lines to use as a guidepost.
It may all mean nothing — even Netflix has a chance of rebounding. The odds of it rebounding just became slimmer though… at least without going through a lot more selling first.
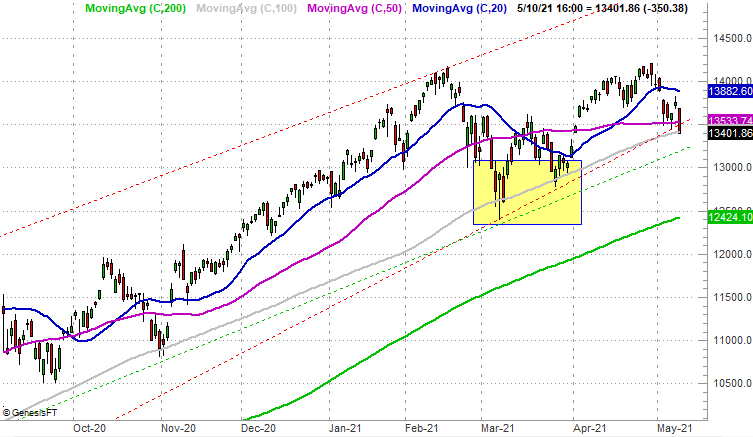
Indeed, to see this much collective weakness from the market's most prolific names sets a concerning tone. The NASDAQ Composite tends to lead the broad market, up and down. Monday's selloff pulled it down to the 100-day moving average line (gray), which has been an important floor since March (highlighted). One more bad day could break that support and finally let the profit-taking floodgates open. It will be interesting to see how much – if any – such an event would impact the FANG names, and/or how much the FANG names will steer the NASDAQ Composite over the proverbial edge.
 [4]
[4]
Would you like to capitalize on the incredible volatility of all the FANG stocks? Our FANG Options Advisory does just that, using trading algorithms custom-built for each of these individual charts. Bullish or bearish, it doesn't matter. The FANG Options Advisory can make money regardless of the direction these charts are moving. Check it out here [5].