It's been a while since our last look at the FANG stocks; there's not been much to discuss. Over the course of just the past few days though, that's dramatically changed. The five stocks that make up the FANG group aren't all moving in the same direction, and even the ones that are aren't moving in those directions at the same pace. There are trades buried in all this movement.
But, first things first.
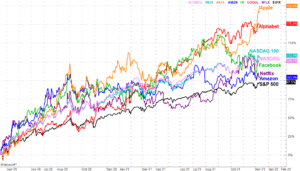
Here's a performance comparison of the FANG stocks since their lows hit in March of last year. For reference, a handful of major indices are also on the chart. Every FANG name is outpacing the S&P 500, but only half of them are doing better than the NASDAQ-based indexes despite being listed at that exchange. Note than Netflix (NFLX) and Amazon (AMZN) have both remained subpar performers since the middle of last month, while Apple (AAPL) shares have soared to record highs since around that same time.
 [1]
[1]
Broadly speaking, trends are trends until they're clearly not. In this vein, it looks like Apple's a buy while Netflix and Amazon are sells. When you drill down into each stock's chart and really dissect this recent action though, such assumptions aren't necessarily supported.
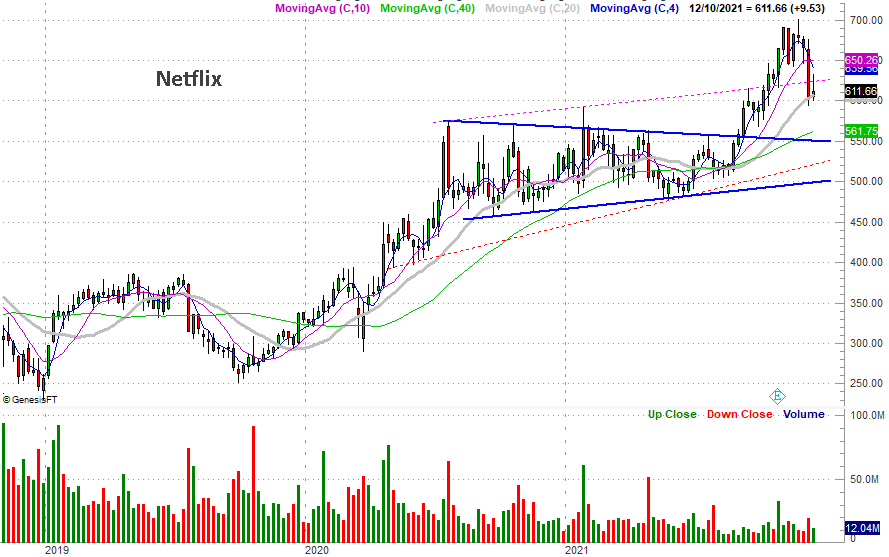
Let's start with Netflix, looking at it with a weekly chart. It clearly soared between September and November, being squeezed out of a converging wedge pattern. The rally ran out of steam late last month though, and that took a toll two weeks ago. Things didn't improve any last week. And, notably, there's still room for the stock to keep falling before it finally finds a floor, if the 100-day moving average line (gray) isn't able to keep it propped up — like it is now — any longer.
 [2]
[2]
Amazon also looks like it might be in a bit of trouble in light of the performance comparison chart. When you look at a conventional daily technical analysis chart though, that idea comes into question. Shares of Amazon are finding plenty (albeit choppy) support at all of its key moving average lines. And, it continues to chip away at horizontal ceilings (plotted in blue). The stock remains within striking distance of pushing above one of those ceilings, at $3547, which could prove bullishly catalytic.
 [3]
[3]
As for Apple, it looks unstoppable here, but looks can be deceiving. The stock's blasted past any prospective ceilings, but has arguably moved too far and too fast for its own good. As of the latest look the stock's now 28% higher than its 200-day moving average line (green). That's incredible, unusual, and also leaves AAPL ripe for profit-taking.
 [4]
[4]
That's not a prediction, to be clear. Overbought stocks can get overbought and stay overbought for a long time, rallying the whole time. In other words, while overextended and due for a sizeable pullback, there's no telling when Apple might actually start to make that move.
There's more.
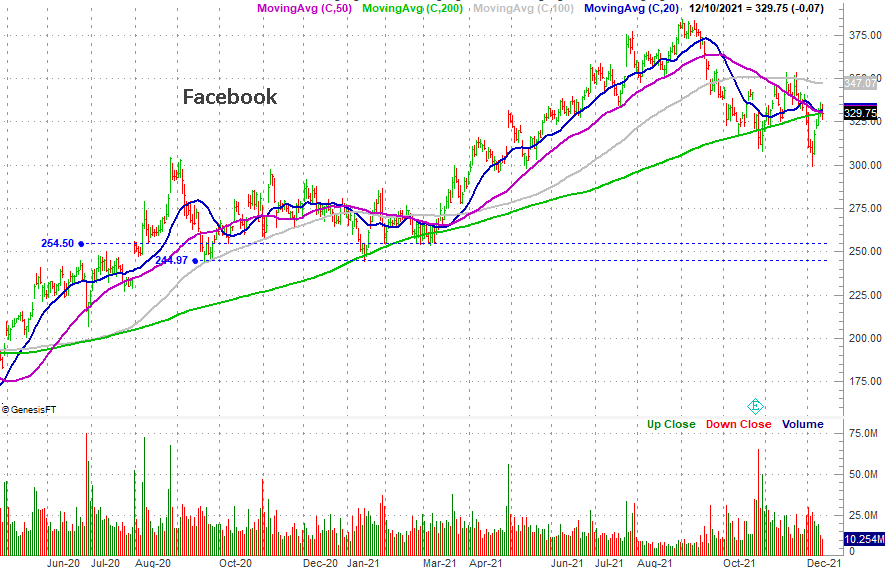
While the performance comparison graphic makes it look like Facebook is holding up reasonably well, in reality, it may not be. The stock's actually slowly-but-surely fallen (back) under its 200-day moving average line (green) as of Friday. That dip also pulled the stock below its 50-day line (purple), which also fell under the 200-day moving average on Friday… a so-called "death cross" that often indicates that the trend has turned decidedly bearish. Note that Facebook shares found support near the 200-day moving average line in February and March.
 [5]
[5]
If the red flags that started waving in earnest on Friday are indeed an indication of what's to come, the next-best and most likely landing spot is around $254, where shares found horizontal support for several days in February and March. That level is marked with a blue, dashed line.
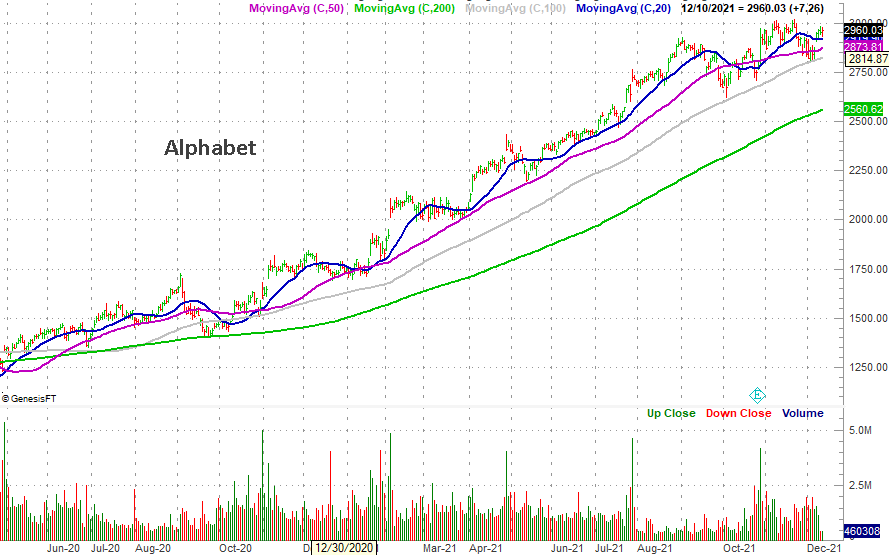
As for Alphabet, its uptrend actually looks the healthiest and most sustainable of all five FANG names. It's finding pretty consistent support at most of its key moving average lines. Even so, there's no denying the stock's hit something of a headwind in recent weeks. The 100-day moving average line (gray) is being repeatedly tested as a floor, and this stock is one of a few that didn't manage to hit new record highs last week.
 [6]
[6]
That's not the end of the world. Alphabet shares are in the habit of moving higher in a stairstep pattern; the current lack of progress could just be a flattened period before the next move higher within that pattern. There's certainly no guarantee that's what's happening here though, particularly given how far the stock's climbed since early last year. There's a lot of profit-taking potential on the table here.
What's curious about the FANG stocks here is how different their recent performances have been. While they never move completely in tandem, this degree of difference in how they're moving is rather unusual.
That doesn't really matter. In fact, this disparity is a good thing, as it offers more trading opportunities than you'd expect when these big tech names are moving as a herd. Just keep an eye on the individual charts at least as much as you're keeping tabs on their relative performances.
Would you like to take advantage of the movements being made by the market's most active and most-watched stocks? Take a look at the BigTrends FANG Option Advisory, which is solely focused in capturing the ebbs and flows of these names. Go here to learn more [7].