By Annie Pei, CNBC [1]
The S&P 500 has hit another record high, and TradingAnalysis.com founder Todd Gordon says the rally could take the markets further into uncharted territory.
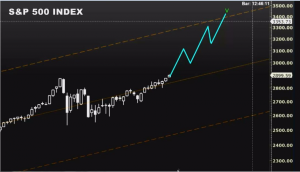
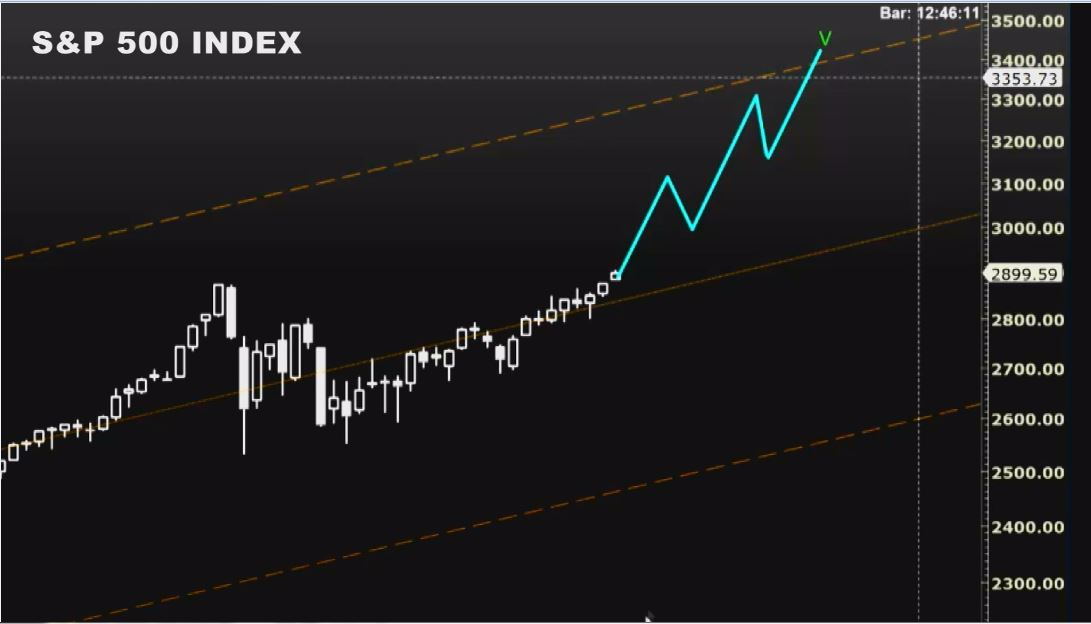
"At the current angle of descent, we have resistance up around the 3,400 to 3,500 mark in the S&P 500," Gordon said Tuesday on CNBC's "Trading Nation." At this level, Gordon says the final leg of the Elliott Wave Theory in the S&P 500 from the 2009 low will be complete. A move to 3,500 would represent a more than 20 percent gain from where the S&P closed Tuesday at around 2,897.50.
The Elliott Wave Theory posits that market trends move in a succession of waves that can be used to foresee the next leg up or down.
 [2]
[2]
Last September, the trader identified an uptrend channel in the S&P 500 based on Elliott Wave Theory lines. After the S&P corrected itself on the second and fourth wave, Gordon sees the index as entering the fifth and final wave of the trend.
"That does allow further upside," he said.
Gordon says the final wave still needs to make its way up to the ceiling of the parallel channel that has been in place since early 2012.
For a more short-term play on the rally, Gordon looks to buy a call spread on the S&P-tracking ETF SPY. He wants to buy the October monthly 295-strike calls and sell the October monthly 300-strike calls for a total cost of $1.04, or $104 per options spread.
This means that if SPY were to close below $295 on the Oct. 19 expiration, Gordon would lose $104 on the trade. However, if SPY rallies and closes above $300 on Oct. 19, then Gordon would make about $400 on the trade.
With Tuesday's record-setting rally, the S&P 500 is now up over 8 percent year to date.
From CNBC [1]