
On Thursday our Options Shark trading advisory locked in a 57% gain on some Bed, Bath & Beyond (BBBY) put, which we detailed in an exhaustive and enlightening look [1]. That look was explicitly a look through a "gamma" lens though… one of the more obscure option Greeks. There's still a lot more to be learned from the BBBY trade, whether or not you trade options. We'll look at the other noteworthy aspects of the trade today, paying particular attention to what prompted it in the first place. The clues weren't the conventional ones you might expect.
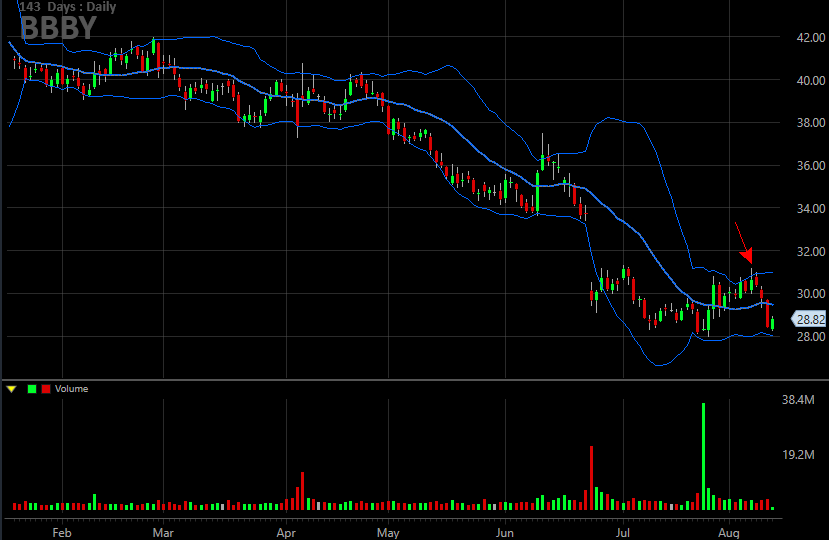
There were a handful of factors that led us to believe on Monday of this week that Bed, Bath & Beyond shares were destined — at least in the short run — to move lower. Perhaps the biggest of them was the simple fact that BBBY shares were bumping into their upper 20-day Bollinger band (2 SDs) the few days before Monday, but had been unable to move above that line. That wouldn't have meant quite as much as it did, however, had the stock not struggled several times already with the upper Bollinger band line going to late last year. Once a pattern is established, it tends to repeat itself.
 [2]
[2]
That wasn't the only clue that spurred the trade, however. The other big one (and arguably the bigger of the two) was what happened on Monday morning shortly before we entered the put option around 10:30 am.
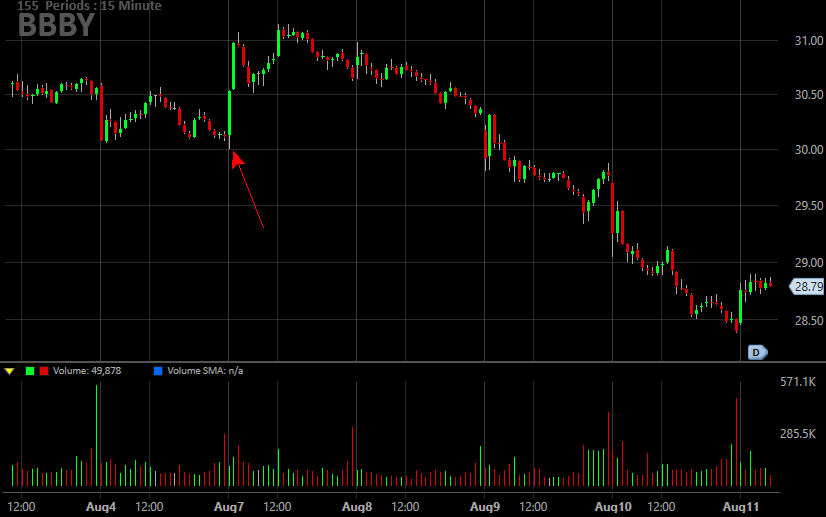
The red arrow on the intraday chart (15 minute bars) marks the beginning of Monday's action; the stock got started with a bang, surging for the first half-hour of trading. Take a look at the volume behind the first two bars for that day though. While the gains were huge, the number of shares behind the big move wasn't impressive. In general, big moves should have big participation, if they're to last. This one didn't have that volume, and sure enough, it didn't last.
 [3]
[3]
There's one last key clue though, and while it didn't set up the result we quite expected, it was still at the heart of the trade-worthy pullback.
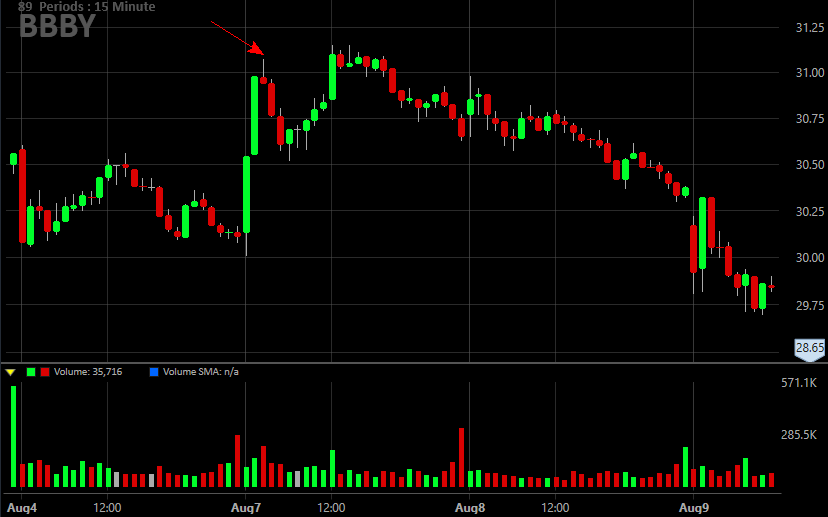
Take a look at Monday's third 15-minute bar of the day (marked with an arrow on our zoomed in chart). It looks like an upside-down hammer, where the head of the mallet is at the bottom of the bar, and the upper portion of that bar serves as the handle for the hammer. This pattern generally indicates the transition from a net-buying environment to a net-selling environment.
 [4]
[4]
Obviously the bears initially followed through on the hint, sending Bed, Bath & Beyond lower for the next two bars. The bulls fought back shortly after that, and for a while looked like they might force a big breakout move. Take a closer look at the chart again though. That hammer-shaped reversal bar was also one made on higher volume than either of the two bullish bars that materialized right before the upside-down hammer did. That's a hint that a bunch of people were looking to take their profits and get out.
The reason we weren't scared about the rally effort that unfurled by mid-day? That move still had to contend with the daily chart's upper Bollinger band… a ceiling that had already proven itself several times already. You wouldn't have known about that ceiling unless you were also keeping detailed tabs on the daily chart.
The overarching lesson here is the same basic one we discussed back on July 21st [5], explaining it always helps to get a second opinion, and it's usually a good idea to get that opinion from a chart with a different timeframe — you can see a lot of different things just from a slightly different viewpoint.
There's no right or wrong timeframe to consider. Just make sure it's an appropriate one for your style of trading. Long-term investors may want to consider daily and weekly charts, for instance.
Just as important, though, is examining several different types of technical analysis tools. In this case we mulled Bollinger bands, volume and the shape of bars… an art from the Japanese candlestick playbook. One-dimensional trading makes it too easy to overlook dangers as well as opportunities.