
For weeks now we've followed the slow but increasingly certain recovery of crude oil prices. Though in the minority in terms of our mostly-bullish outlook, the call has panned out. Indeed, it got even more certain as of last week, when an old resistance line became a new support line.
While this is bullish in and of itself — and supports our bullish thesis — the chart of oil right now also dishes out an important lesson worth remembering.
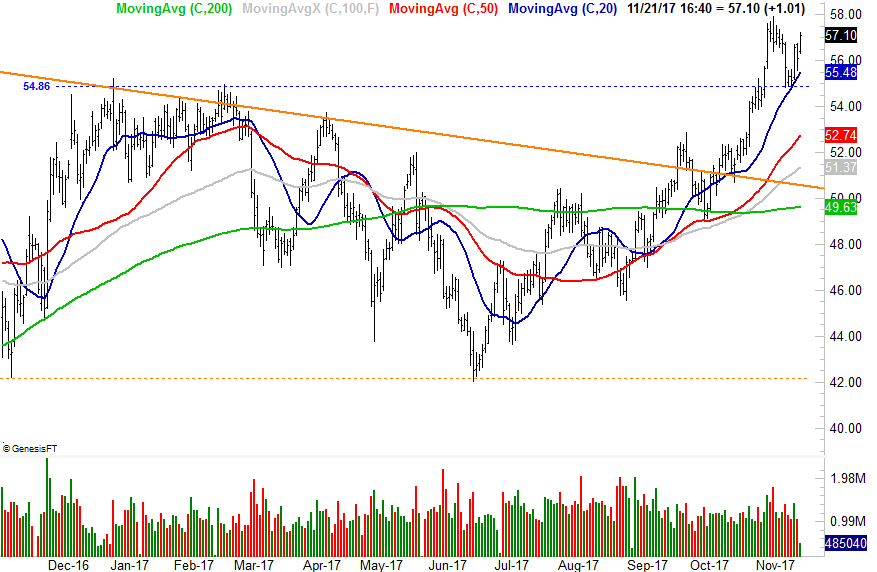
Take a look. As expected, the early-November surge set the stage for some profit-taking, and down she went. Crude oil peeled back from a peak of $57.92 to a low of $54.80 just a few days later, hit early last week. Notice, however, where the floor was made to set up the current advance. That $54.86 level was a minor resistance line in as October became November, but it was a major resistance line late last year and early last year.
 [1]
[1]
It's a great example of how former resistance lines can become support lines, though the opposite also applies. That is, former support lines can and often do become resistance lines.
Sure, the 20-day moving average line likely played a role in forming the reversal, but it was a secondary role. Crude prices are over a key hump, and though they may waffle a bit here, they're still on the bullish side of the fence. This opens the door to even higher highs.
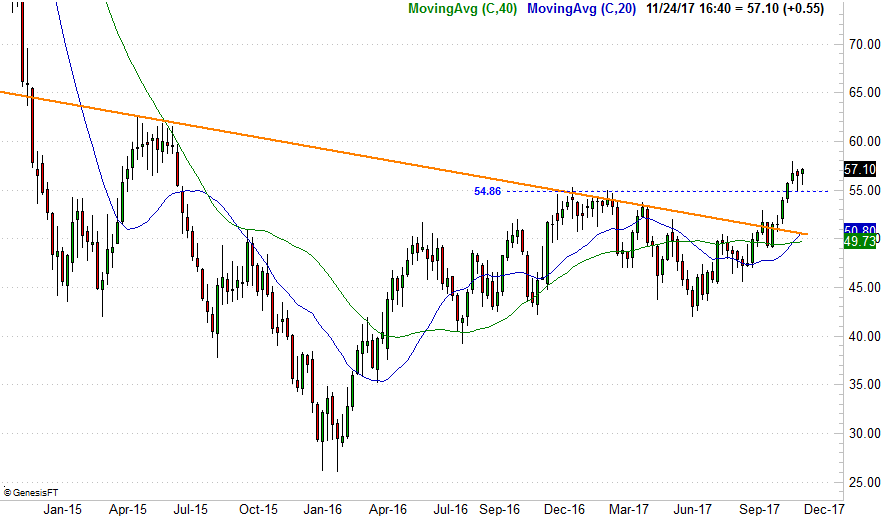
Zooming out to a weekly chart we can gain some valuable perspective on this recently-renewed rally. From this vantage point we can (still) see the upside-down head-and-shoulders pattern we first discussed back on October 27th [2]. As discussed then, though few saw it, the stage was set. Oil was priced at $53.79 then. Now it's $57.10, yet we've not see the full potential of the head-and-shoulders patterns realized yet. That target is still closer to $70 than $60.
 [3]
[3]
That sounds like a crazy upside move, and bear in mind crude won't get there in a straight line if it gets there at all. Also bear in mind, though, the possibility of oil at $57 per barrel also seemed impossible just three months ago.
Obviously there are never any guarantees in trading. It's just a game of odds, and weighing the risks and rewards appropriately. Right now, however, the odds are quietly pointing bullishly even if the rhetoric suggests otherwise. Bear in the mind the rhetoric wasn't bullish in 2014 either, and the energy market got crushed.
In the meantime though, just remember this chart as proof that a chart's history can affect a chart's present. Old support and resistance lines can and do become present resistance and support lines.