
Two weeks ago, gold prices were falling, and even teetering on the edge of a major breakdown. What a difference two weeks can make. Right on cue, and finally with a little help from the U.S. dollar on Thursday, a budding turnaround from gold took firm hold. With the undertow moving in a bullish direction again, it wouldn't be wrong to start talking about upside targets and judging how firm of a foundation this new rally effort is building on.
The chart below isn't a tough one to decipher. Between a brush with the support provided by the 200-day moving average line (green) and the rising support line (blue) that tags all the major lows going back to late last year, we got a nice, U-shaped reversal that was bolstered by the recent cross back above the 20-day moving average line (blue, thin).
 [1]
[1]
That shape is important in and of itself. Whereas V-shaped pivots are prone to peter out, rounded bottoms tend to turn into rallies that last a while. Also worth noting is the simple fact that gold futures have gotten into the habit of wide though predictable swings. As we've said before, context — or history — can mean a lot.
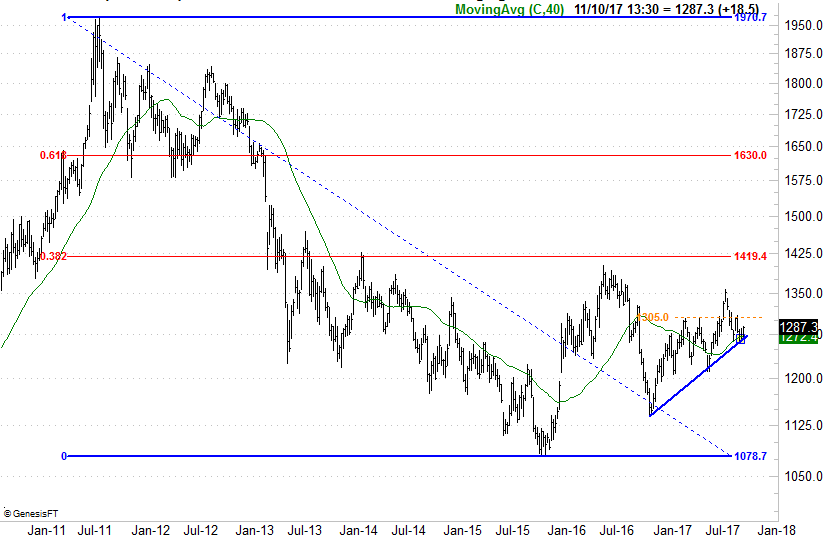
As for where this rally may go, we have to zoom out to a weekly chart of gold prices and apply some Fibonacci retracement lines.
Fibonacci lines are a mathematical and scientific idea, though they have a place in trading. In the same sense Fibonacci lines and numbers occur in nature and math, they also often occur on a chart, since a stock or index's price chart is an 'organic' construct of how people feel about a stock or the market. Think 'crowd psychology,' which is surprisingly predictable. They're also nice to use in the trading world, as they suggest logical support and resistance levels when no other such lines are present. And when Fibonacci lines to intersect with a chart's previous highs and lows, they all mean that much more.
Though not with outright perfection, gold's key Fibonacci retracement lines plotted from their 2011 high and its 2015 low largely align with previous pivot points, making these levels very logical target areas.
Take a look. The 38.2% retracement of the span in question (between $1078 and $1970) is $1419, near where gold prices peaked in mid-2016, and more or less where gold peaked in 2013 and 2014 before they started the second bearish leg that took it to its ultimate 2015 low. That's the most plausible upside checkpoint target if the current rally effort is indeed built to last.
 [2]
[2]
That's a very big 'if,' of course, and such a target would only matter if gold can break past its more near-term ceiling at $1305, plotted with an orange line on both charts. That's where gold has struggled with three of the past four bullish thrusts. As was noted though, the technical turnaround is a healthy, U-shaped one.
And if the stock market finally implodes as it seems to want to right now, the rush out of equities and into safer, defensive havens could drive gold higher in a hurry.
It's certainly something to keep on your radar anyway, along with some lines you may want to plot on your chart of gold futures themselves.