A couple of weeks ago our Credit Spread Trader service booked a 25% gain on a RH (RH) — you know it better as Restoration Hardware — option trade. On the surface it looked like just another trade, and in most regards it was. As is so often the case though, the RH trade "worked" because a couple of noteworthy clues worked together. Since these clues are items you may want to look for on other charts for your future trades, it's worth going back in time a bit to look at why the stock didn't something it didn't seem like it should do with just a passing glance.
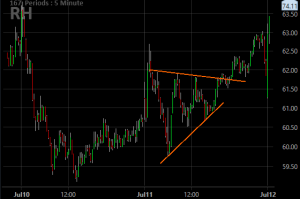
Let's just start with the daily chart of RH; the entry day (July 11th) is marked with an arrow.
 [1]
[1]
What's interesting about our trade was that it was ultimately a bullish position using a put credit spread as our weapon of choice. It was a bullish move many people weren't expecting at the time simply because RH shares were peeling back at the time… from a rather high new high. It looked like a setup for a sizeable pullback.
So why didn't the pullback take shape? This isn't a tough one — the 20-day moving average line (blue) served as a technical support level, as it so often does. Though not with perfection, the 20-day moving average line had been a make or break level for this particular stock more than once in recent weeks.
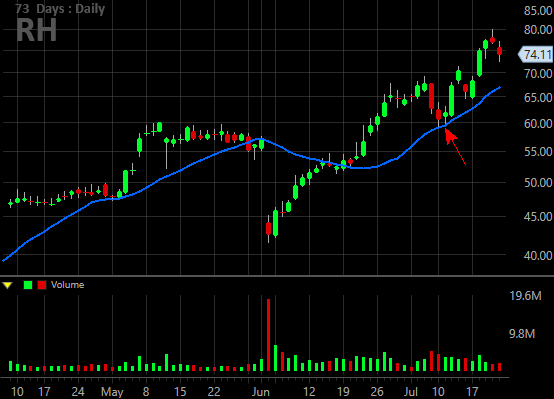
The overarching reason we decided to take a bullish swing on RH, however, is best understood with a look at an intraday chart. We'll look at a five-minute chart, just because it most cleanly tells the story.
Take a look at the entire July 11th bar, bearing in mind we didn't get into the trade until after 2 pm EST that day. In other words, we had almost an entire session's worth of information to work with. The early bullish start was certainly exciting, but wasn't built to last. By 11 am that day, RH was deep into the red, and looked like was falling over a cliff. That's when something curious started to happen. That is, the stock bounced and started to form a converging wedge pattern (framed in orange).
 [2]
[2]
It's the back-and-forth action that mean so much, when it's part of a wedge shape. It suggests the undertow is consolidating into one unified movement with all the volatility shaking out the uncommitted owners and letting all the committed buyers trickle in. By 2:15 that day RH had fought its way above the upper edge of the converging wedge shape, which is the same point when the buyer/seller balance tilted in a decidedly bullish direction.
Had we not seen the triangle-shaped pattern so well defined by the intraday ebbs and flows, we might not have been willing to pull the trigger on the breakout thrust later in the day.
Not every trade signal looks like this one, nor does it have to. At the same time, not every trade signal works as well as this one did. All the same, the more hints you have pointing in the same direction, the better, and the intraday chart is one too many traders overlook even though it can tell you quite a bit.
Moral of the story? Look for all the available clues you can.