Why it might be time to bet on emerging markets
by Annie Pei [1]
The emerging markets have been trading in a range for the past few months, but one trader sees signs of a breakout to the upside.
Todd Gordon of TradingAnalysis.com said a popular emerging markets ETF, the EEM [2], has being "pretty beaten down" this year but from a technical standpoint, it could be headed for a consistent rise.
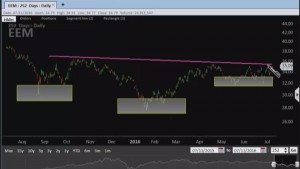
On a chart of iShares MSCI Emerging Markets Index Fund ETF (EEM), Gordon gets specific and takes a look at the ETF's recent moves.
"We have a left shoulder, we have a head and we have a right shoulder right here. This is a technical pattern called an inverse head and shoulders," he said Monday on CNBC's "Trading Nation." [3]
An inverse head and shoulders is a chart pattern that is thought to precede a trend reversal.

On Monday, the EEM rose to its highest level since April.
In addition, Gordon also believes that based on the EEM's more recent levels, $35 is the breakout level to watch.
"If we can break through $35, the pattern is complete and it looks like we'll get some help internationally for our domestic market rally," he said.
In fact, the EEM's premarket price was $35.18 on Tuesday morning.
Since options prices on the EEM have fallen, Gordon suggests simply buying a call option [4] to bet on the ETF, rather than simultaneously buying a call and selling a higher strike call to make a call spread [5].
Courtesy of cnbc.com [6]