Chart Analysis Of Oil, Dollar, Commodities
Has Oil Finally Bottomed?
by Gary Savage [1]
Has oil finally bottomed? I think yes… well at least temporarily. Let me explain.
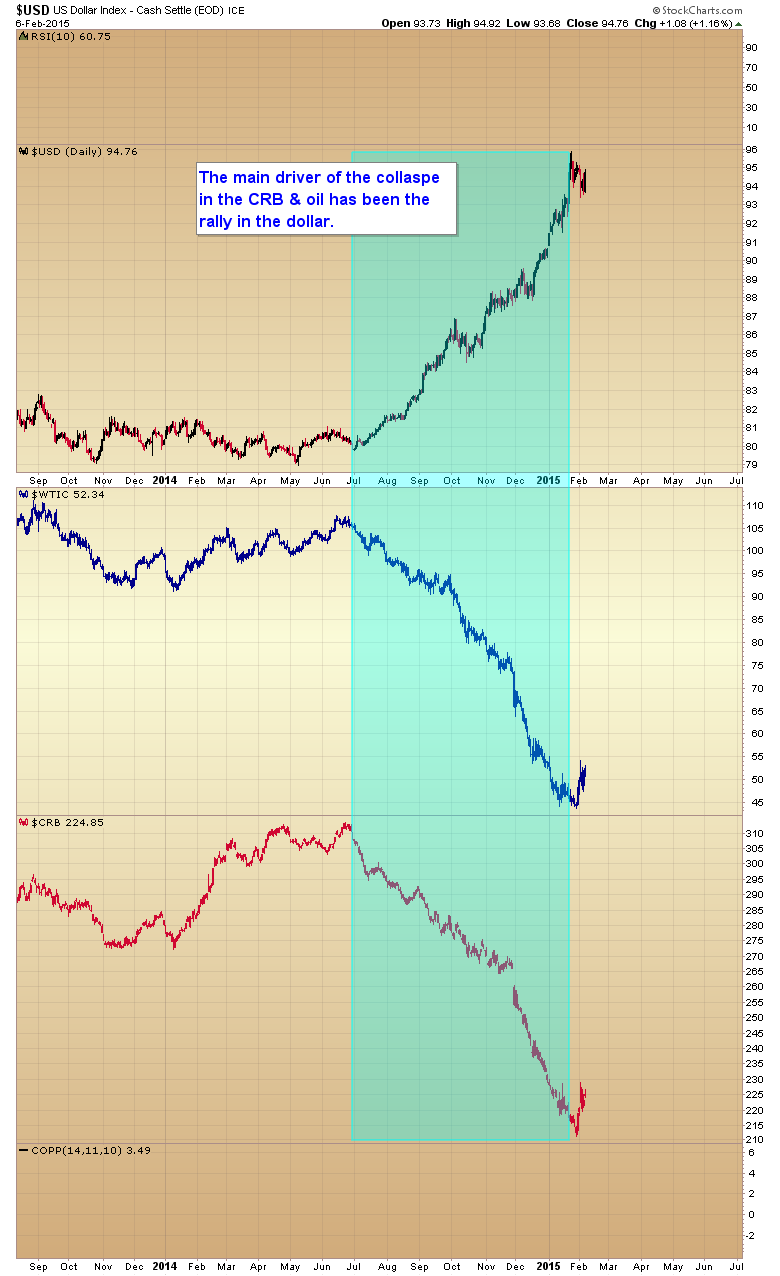
A main culprit driving the CRB (Commodity Research Bureau Index, a basket of commodities) and oil (USO) down over the last 7 months has been the powerful surge in the dollar (UUP).
Dollar / Oil / CRB Chart
 [2]
[2]
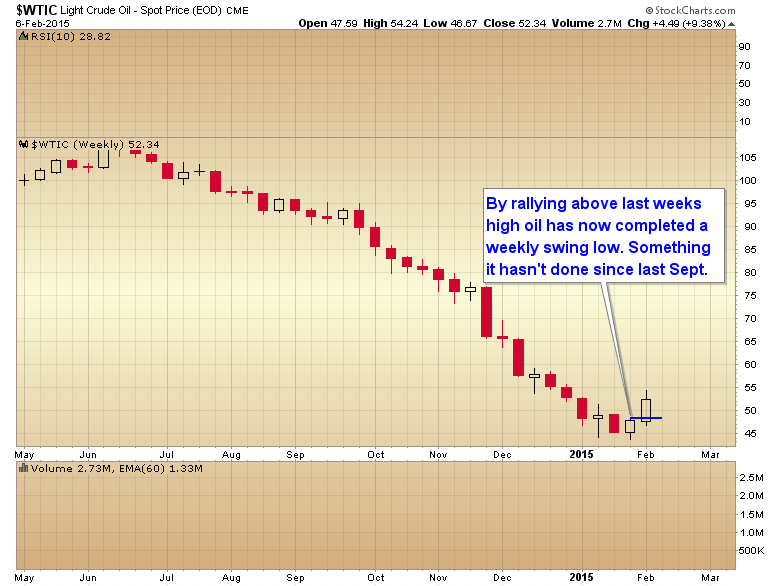
Over the last week oil has shown all the signs of putting in an intermediate degree bottom. It has completed a weekly swing low, along with a classic undercut bear trap reversal. Both are signs that a larger degree bottom has formed.
Oil Weekly Chart
 [3]
[3]
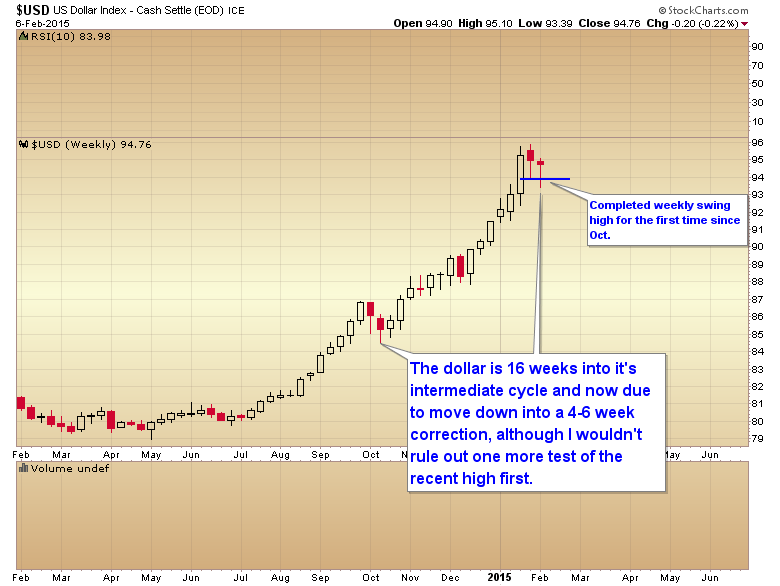
If oil has put in an intermediate cycle bottom as I believe it has, then it should rally for at least 4-6 weeks before topping and moving back down. And if the tight inverse correlation with the dollar holds, that suggests that the dollar is about to take a breather for a few weeks and move down into its own intermediate degree correction.
Dollar Index Weekly Chart
 [4]
[4]
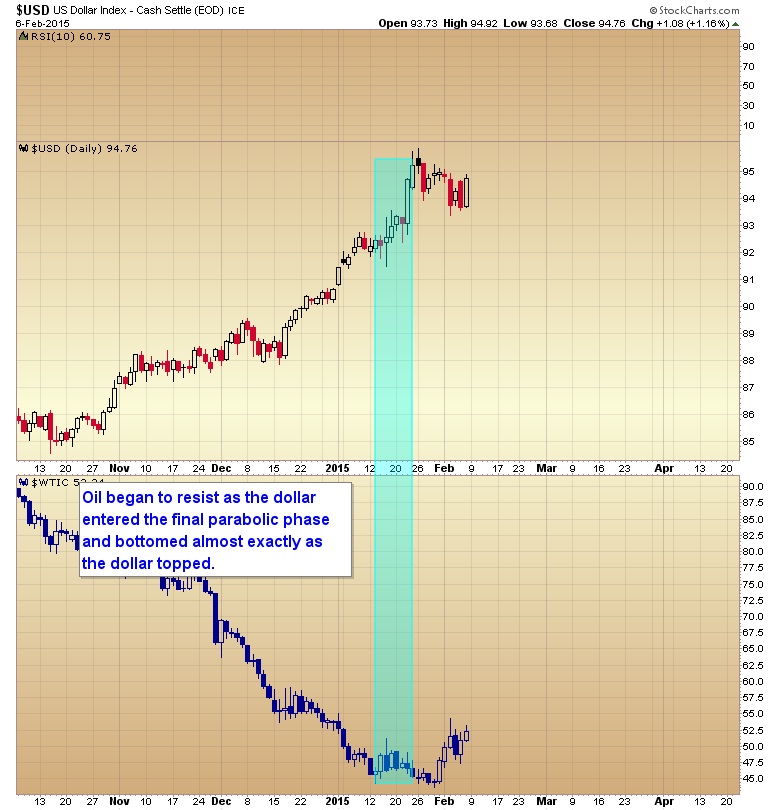
If you compare the two charts you can see oil started to rally almost exactly as the dollar topped.
Dollar / Oil Daily Chart
 [5]
[5]
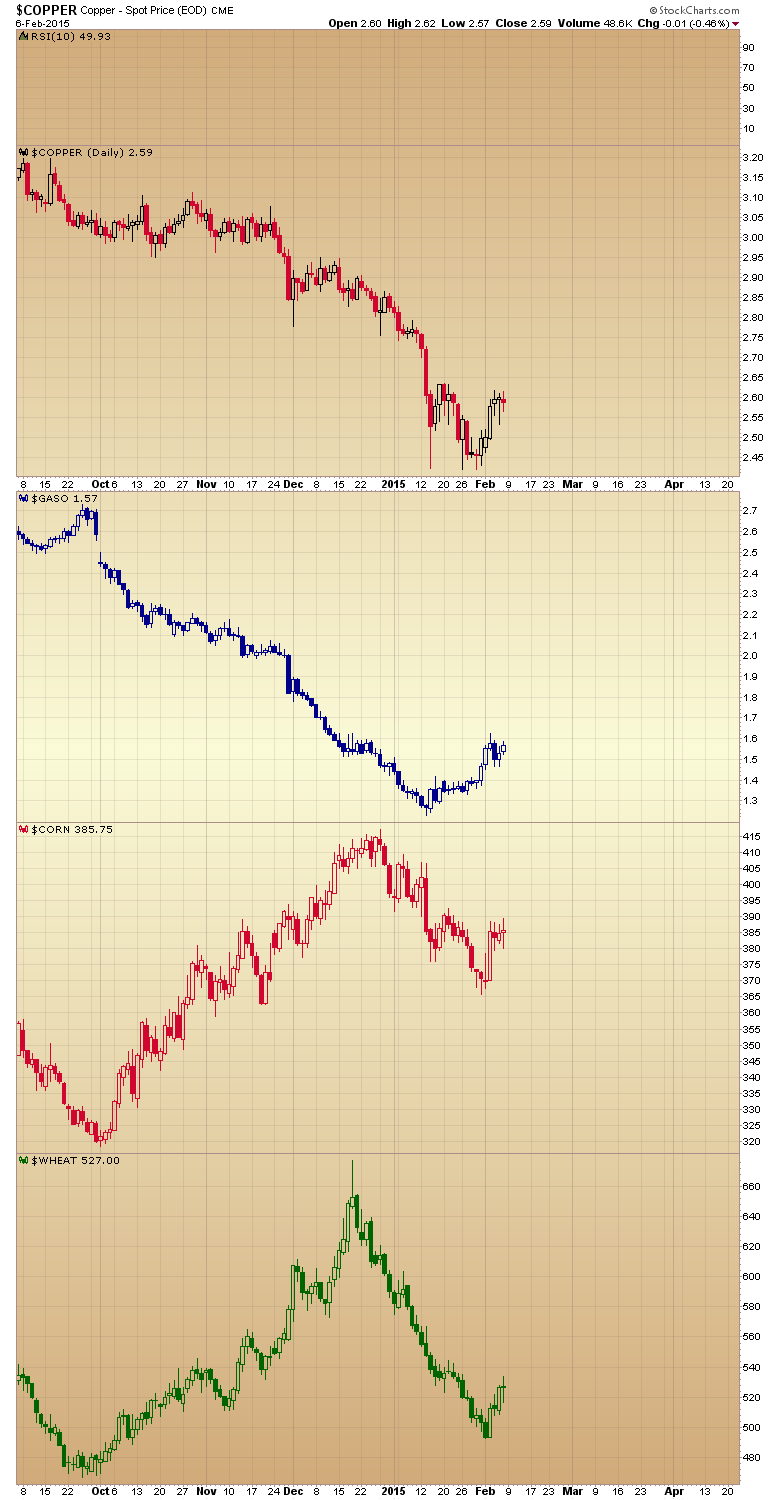
Many other commodities are also bottoming, or have already bottomed confirming this probably isn’t just an energy phenomenon. On the following chart are Copper (JJC), Gasoline, Corn, and Wheat:
Copper / Gasoline / Corn / Wheat Chart
 [6]
[6]
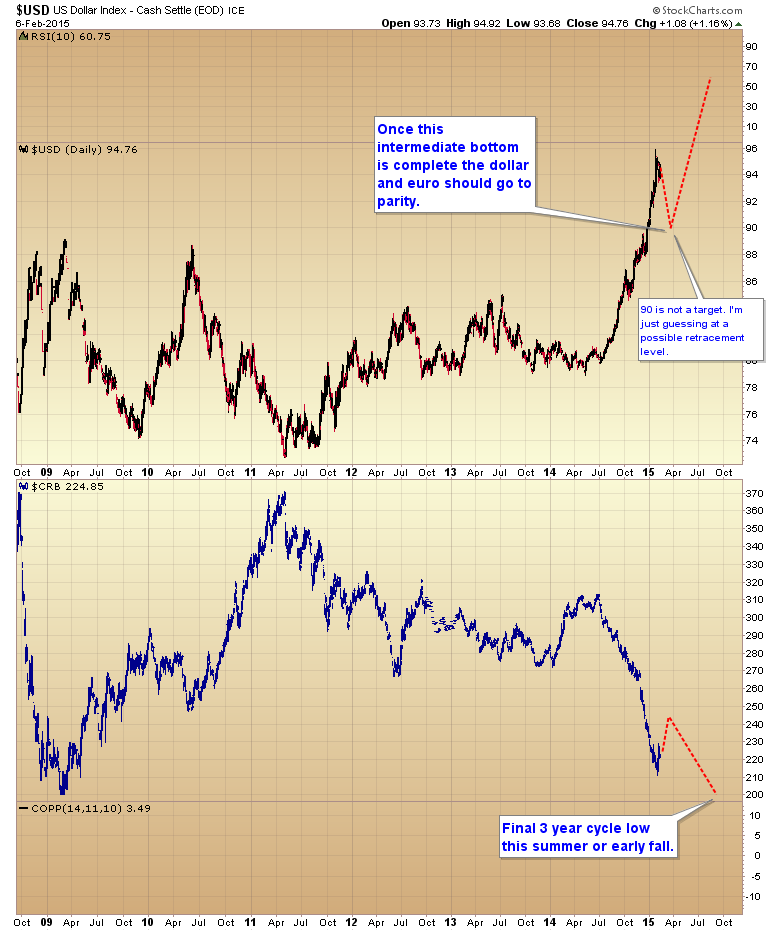
Let me warn though that this is likely just a bear market rally as the final 3 year cycle low isn’t really due till later this year. So I expect once the dollar finds its intermediate cycle bottom in March or early April then back up it will go until the euro (FXE) reaches parity, and back down the CRB will come likely testing the `09 lows before striking a more lasting bottom later this summer or early fall.
Dollar / CRB Chart
 [7]
[7]
For the next 4-5 weeks though, look for some respectable gains in oil and in the commodity sector.
Courtesy of Smart Money Tracker [1]