
Historical pattern says the risk of a 2016 bear market is zero
by Simon Maierhofer [1]
In physics, escape velocity is the minimum speed needed for an object to break free from the gravitational attraction of a massive body. What is the “escape velocity” needed for stocks to break their down trend?
Unlike in physics, there is no fail-proof formula for stocks. However, based on history, the S&P 500 just rallied strongly enough to end its down trend. How so?
Stock-market 'escape velocity'
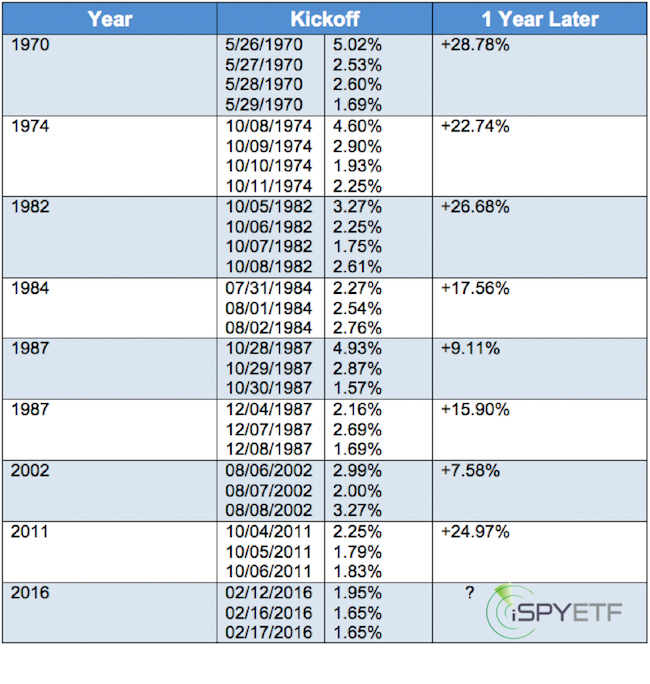
On Feb. 12, 16 and 17, the S&P 500 gained more than 1.5% a day for three consecutive days. Since 1970, this has happened only eight other times. The table below lists each occurrence along with the daily consecutive gains, and the return a year after the last “kickoff” day.
 [2]
[2]
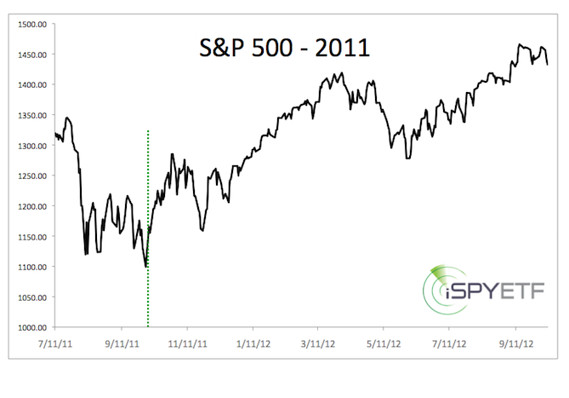
The charts at the bottom of the column provide a snapshot of each kickoff rally (dashed green line) and how the S&P 500 did 60 trading days (about three months) prior, and 255 trading days (above one year) thereafter.
Observations
- Every single time the S&P 500 gained more than 1.5% a day for three consecutive days, it traded higher a year later.
- The S&P 500 violated the low set prior to the kickoff move only twice (1987, 2000). Both times it bounced back quickly.
- In 2016, the S&P 500 closed at a 52-week low before its kickoff rally. In 1970, 1987 and 2011, the S&P 500 also closed at a 52-week just before soaring higher.
- Obviously, kickoff rallies like this are not the only factor driving stocks, but this particular pattern confirms the six reasons for a stock market rally listed by the February 11 Profit Radar Report.
- The Feb. 11 Profit Radar Report recommended buying the S&P 500 at 1,828 (after it fell as low as 1,810) in anticipation of a sizeable rally.
- As compelling as this historic pattern may be, tunnel vision is a luxury investors can't afford. It's worth noting that the 2016 kickoff is weaker (in terms of consecutive percentage gains) than prior kickoff rallies, and our major-market-top liquidity indicator raised a caution flag in May 2015.
- The scope of this rally has yet to be revealed, and a break below the February low is still possible (like in 1987 and 2002).
- Regardless of the S&P's near-term path, history says we shouldn't under estimate this kickoff rally. Acting on the sentiment-based buy signal at S&P 1,828 provided a low-risk entry point and insurance against a runaway rally.
A more detailed sentiment-based S&P 500 forecast is available here [3].
 [4]
[4] 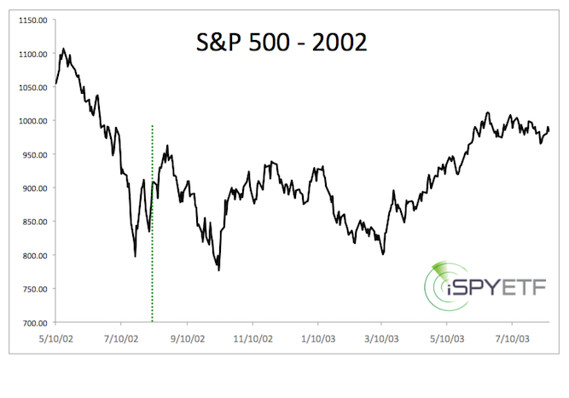 [5]
[5] 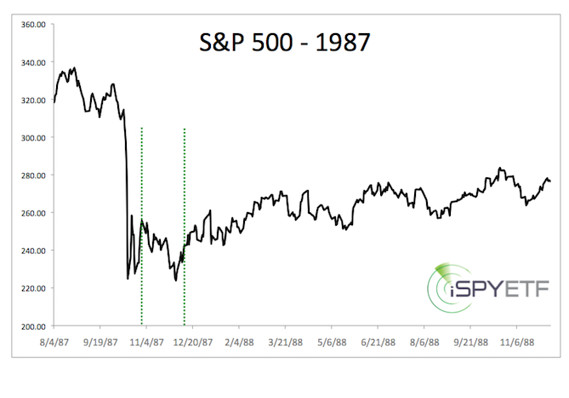 [6]
[6] 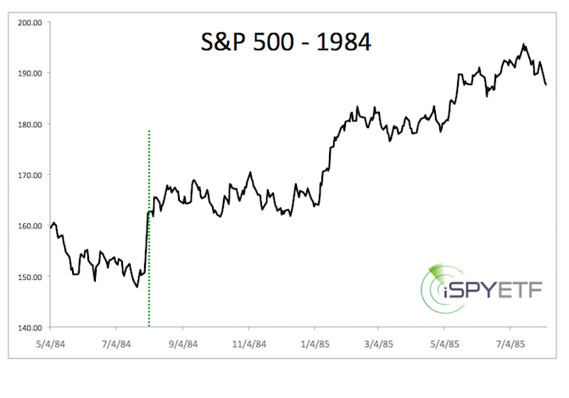 [7]
[7] 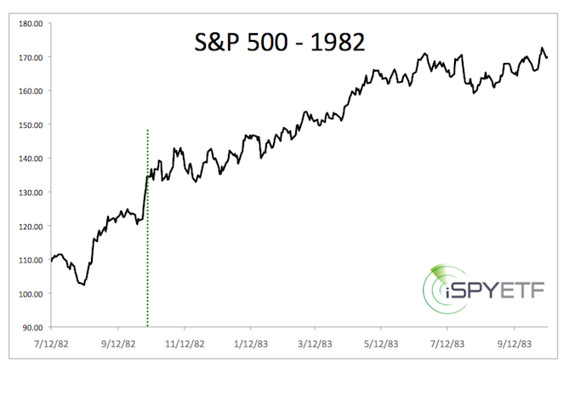 [8]
[8] 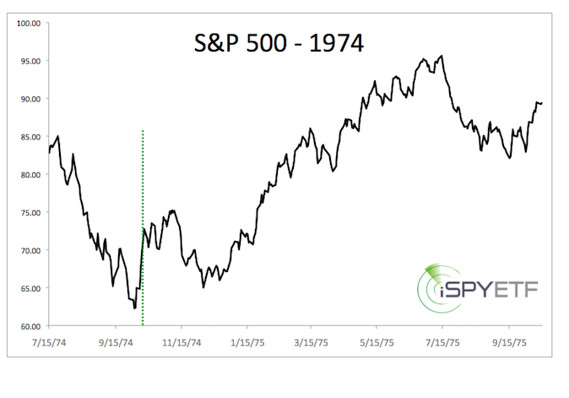 [9]
[9] 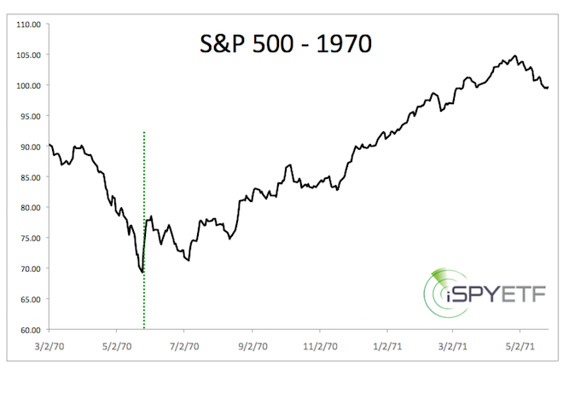 [10]
[10]
Courtesy of marketwatch.com [11]