
It seems odd to believe given the manic selloff that jump-started the meltdown to-date. But, last week was actually the worst week of the four-week plunge. The S&P 500 gave up 15.2% of its value, with most of that hit taking shape on Monday and Friday. The three days in between were actually kind of promising. In fact, as odd as it may be to hear, the selloff isn't as bad as it may appear with just a superficial glance.
Don't misread the message. It's pretty hairy to be sure. But, given how the market just logged its worst week in eleven years, which followed one of the worst weeks also several years, the selling has actually been somewhat contained. The worst of the meltdown may actually be in the rearview mirror.
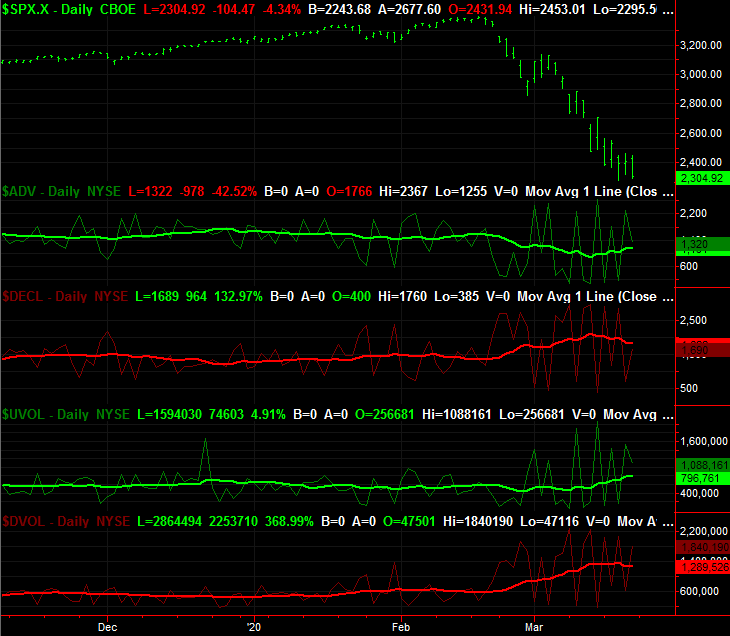
There's a reason for that idea rooted in more than mere hope. Take a look at the graphic below, which compares the S&P 500 to the NYSE's advancers and decliners, and the NYSE's up volume and down volume.
The daily breadth and depth data is too erratic to interpret, so to smooth it out into a discernible trend we plot moving average lines on top of each data set. Those moving average lines are the thicker, brighter and less choppy lines laid over each set of daily data, with the advancers and up volume both plotted in green, and the decliners and down volume plotted in red.
 [1]
[1]
Decliners clearly still outnumbered advancers as of Friday, but the number of daily decliners is starting to fade from the mid-March peak. Likewise, although the typical daily bullish volume is still a much lower figure than the daily bearish volume, the daily bearish volume levels have been sinking this week while the daily bullish volume levels have been growing ever so slightly. Notice how on Friday — one of the more painful routs of the selloff — total selling volume for the NYSE peaked on a sequentially lower peak. [You may have to squint to see the thin line there at the bottom of the chart to see the detail, but it’s there.]
None of this is to suggest the market can only go up from here. It can still go down. Clearly there are still enough investors left in the market to respond to what seems like bad news on the COVID-19 front. But, the bulk of them are now out, presumably in cash. There's not a whole lot more plausible fear that can be priced in here.
It's just an observation, though one worth mentally noting if only to assure nervous traders and investors that this will end, sooner or later.
For perspective, the S&P 500 is now 32% off of last month's high. Over the course of the past two bear markets, the index lost 50% and 52% of its peak value before hitting bottom and starting a new bear market. If that's what has to happen now — and it seems like traders are looking for an excuse to price in a recession — we're actually more than halfway there. And those were real recessions rooted in declining earnings and hyperinflation that rising interest rates couldn't quell. Before the coronavirus outbreak (nor now), those conditions didn't exist. Once people can actually get out and stores can open again, we may actually snap back into growth mode pretty quickly. We just need to get over the hump quickly.