
Ouch. With two back-to-back drubbings, the S&P 500 is now down a little more than 6% week to date. It's also back to levels not seen since early December. Though the coronavirus got the blame, that wasn't the crux of the selloff. Stocks were vulnerable no matter what. The coronavirus contagion just got the blame.
Regardless of the reason, the technical damage has been done. The past two days of losses have been so severe it would be surprising if we didn't see some sort of bounce effort. The question is, how long might that last? Not long, realistically speaking.
Perhaps worse, the selloff has been so steep that the indices are now within sight and striking distance of major technical floors.
But, first things first.
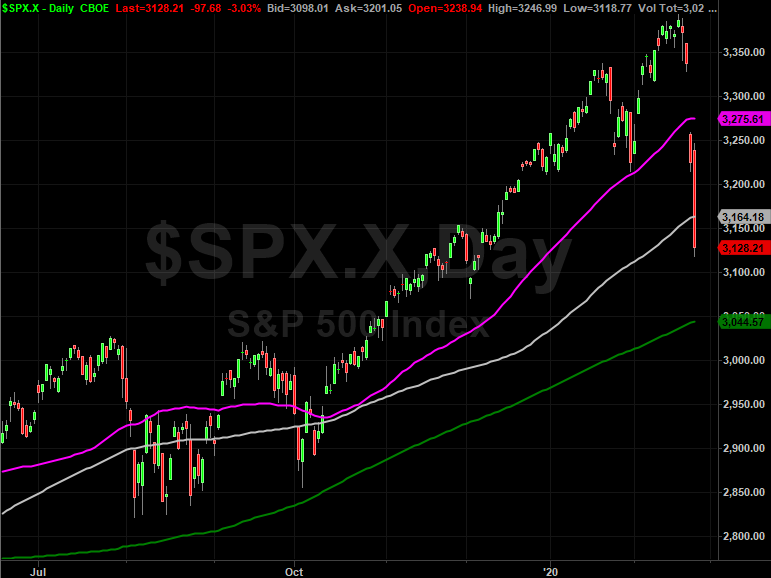
Not only did the S&P 500 not find support at the 100-day moving average line (gray) on Tuesday, it blew right past it without even looking back. The 50-day moving average line (purple) wasn't even a factor.
 [1]
[1]
It's hardly the ideal selloff. The ideal selloff would start steadily and then accelerate, perhaps testing the key moving average lines as support first before pulling under them. Ideally, we'd not see the sort of big gaps we saw like the one we say on Monday morning – the market hates gaps. The sheer speed of the stumble sets the stage for a bounce. Just don't jump to any conclusion should we see a rebound effort start to take shape. It could be nothing more than a dead cat bounce. The index could rally back up to the 50-day moving average line near 3275 and it still wouldn't shake stocks out of trouble.
Of course, a bounce followed by a renewal of the pullback now in place wouldn't mean much unless it pulled the S&P 500 back under its 100-day moving average line at 3164 for a second time. That being said…
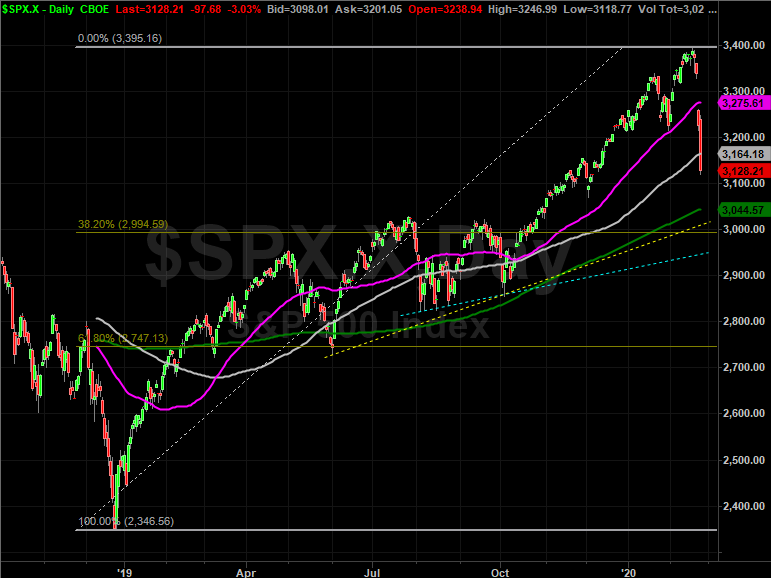
Where any selloff might finally stop and start to lay the groundwork for a true rebound is anybody's guess. But, there's a whole mess of likely support levels all around 3000. That's right where a 38.2% Fibonacci retracement lines, plotting the most meaningful retracement of the big rally that started back in late-2018 (and hasn't been interrupted since). That area also lines up the key lows seen a few times last year, marked with yellow as well as blue dashed lines. The 200-day moving average line (green) is also just above there, at 3044.
 [2]
[2]
Also note that a slide back to 3000 would mark an 11.6% setback from the most recent peak for the S&P 500, which is enough to qualify as a healthy correction.
This is a tricky time for stocks. We can only guess as to what's next, as the market has "gone off the rails" and shrugged off any chance that a chart might offer up some key clues. This is just pure volatility, resulting in what's effectively a coin toss. The only thing working in our favor is that despite the unpredictable volatility in the recent past and now the immediate future, stocks still have to start the next day where they left off the previous one. Eventually – as anxiety and speculation subside – the lines in the sand discussed above will start to matter.