
Top ETFs Of 2016 So Far
The first two months of 2016 are nearly over, and it's been a rough year so far for long-side equity holders in general. The S&P 500 (SPX) (SPY) is down around -3.9% year-to-date (YTD) -- but has actually recovered from the low of down around -10%.
What sectors are outperforming and underperforming the broad market by the most in 2016 thus far? We looked at pure sector play ETFs based on YTD performance -- screening (on FinViz) for liquid names that have options trading and are shortable, as we are looking for ETFs to actively trade with the leverage and flexbility of options. We exclude Ultra/Inverse/Bear/3x etc ETFs from our screen to find the underlying sector names -- also we remove duplicate sector names to find the broadest list (for example, Gold Miners ETF (GDX) is on the list, so we skipped Gold ETF (GLD) as one of the biggest winners -- similarly, we don't have multiple Biotech names on the list, despite their broad weakness this year so far).
Here are the Best of 2016 through February:
Top Performers
(GDX) Market Vectors Gold Miners ETF +36.22%
(VXX) iPath VIX Short Term Futures ETN +20.25%
(TLT) iShares 20+ Year Treasury Bond +8.17%
(XLU) SPDR Select Utilities ETF +7.51%
(SLV) iShares Silver Trust +6.52%
You can see the winners list is entirely comprised of 'flight to safety' type names -- Gold/Silver, Volatility, Treasury Bonds and Utilities. Also note that several of these ETFs were among the biggest losers of recent years.
It's an open question as to whether these ultra-defensive names will continue to outperform in the remainder of 2016 -- but in particular, don't discount the upmoves in Gold/Silver and Utilities.
And now to the Biggest Losers of 2016:
Worst Performers
(XBI) SPDR Biotech ETF -30.67%
(UNG) US Natural Gas -28.95%
(TAN) Guggenheim Solar ETF -24.32%
(OIL) iPath GSCI Crude Oil ETN -22.47%
(GREK) Global X Greece 20 ETF -20.35%
The losers list is comprised of Crude Oil (and Natural Gas) as one would expect, and Greece, which was one of the biggest losers in recent years. But it also contains Biotech ETFs such as (XBI) (IBB) (FBT), which were among the market's biggest gainers for several years since the infamous '666' SPX bottom in 2009 -- a bit of a correction in this sector is not unexpected, and long-term we would expect that group (and Health Care, Medical Devices, etc) to resume upside. However, there may be more short-term pain ahead for that sector, timing of long entry points is key there.
Here is a visual representation of these ETFs compared to the SPYders for 2016 YTD:
ETF 2016 Relative Performance Chart
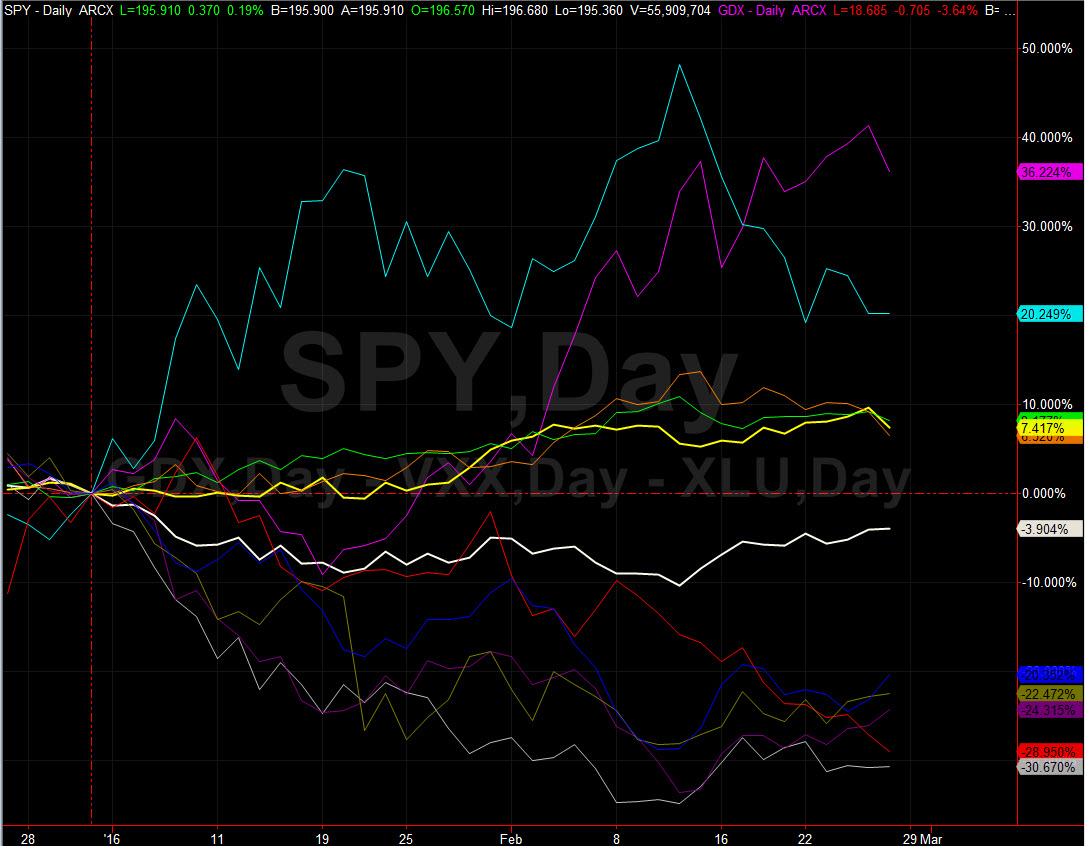
(all charts via TradeStation)
Below are a couple of the most interesting big picture long-term charts (covering around 5 years of past performance) from the names above -- but reminder that we are generally short-term option traders, so we may trade any of these ETFs in either direction at any time, and the short-term trends may differ greatly.
SLV Long-Term Weekly Chart
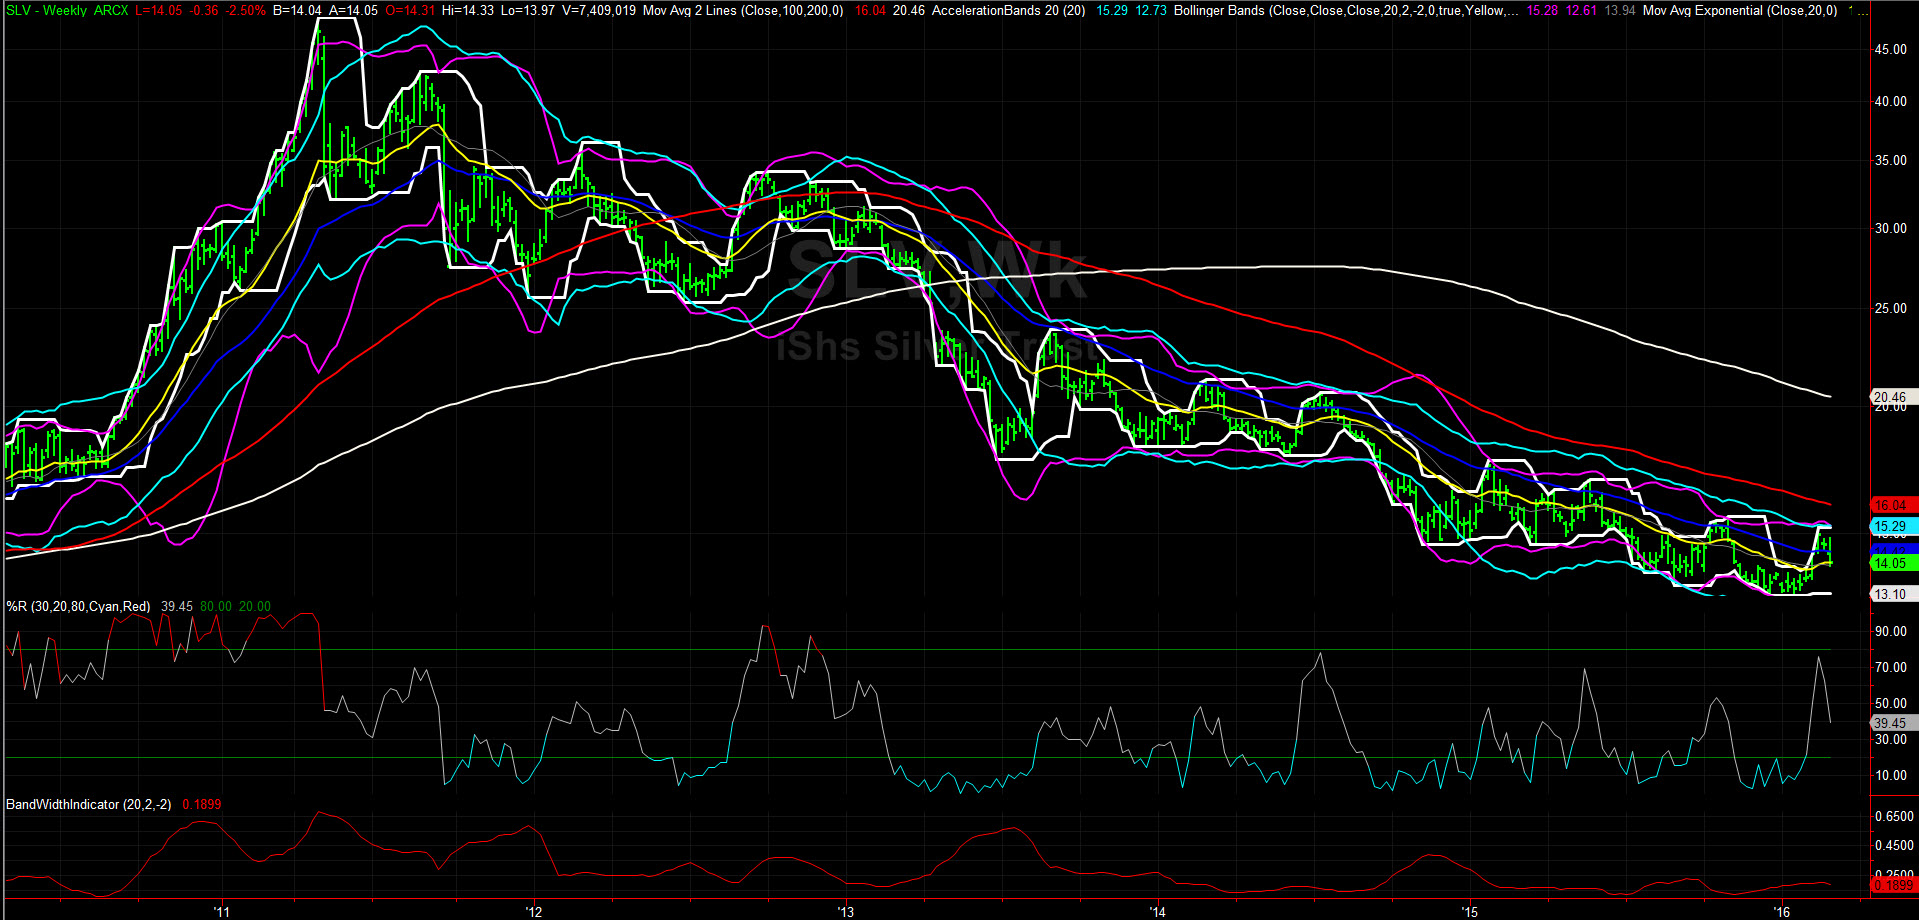
Note that despite the 2016 rally, SLV is still in a long-term downtrending channel going back several years -- but also see that the ETF had a huge run-up in 2010/2011 from similar lows.
XBI Long-Term Weekly Chart
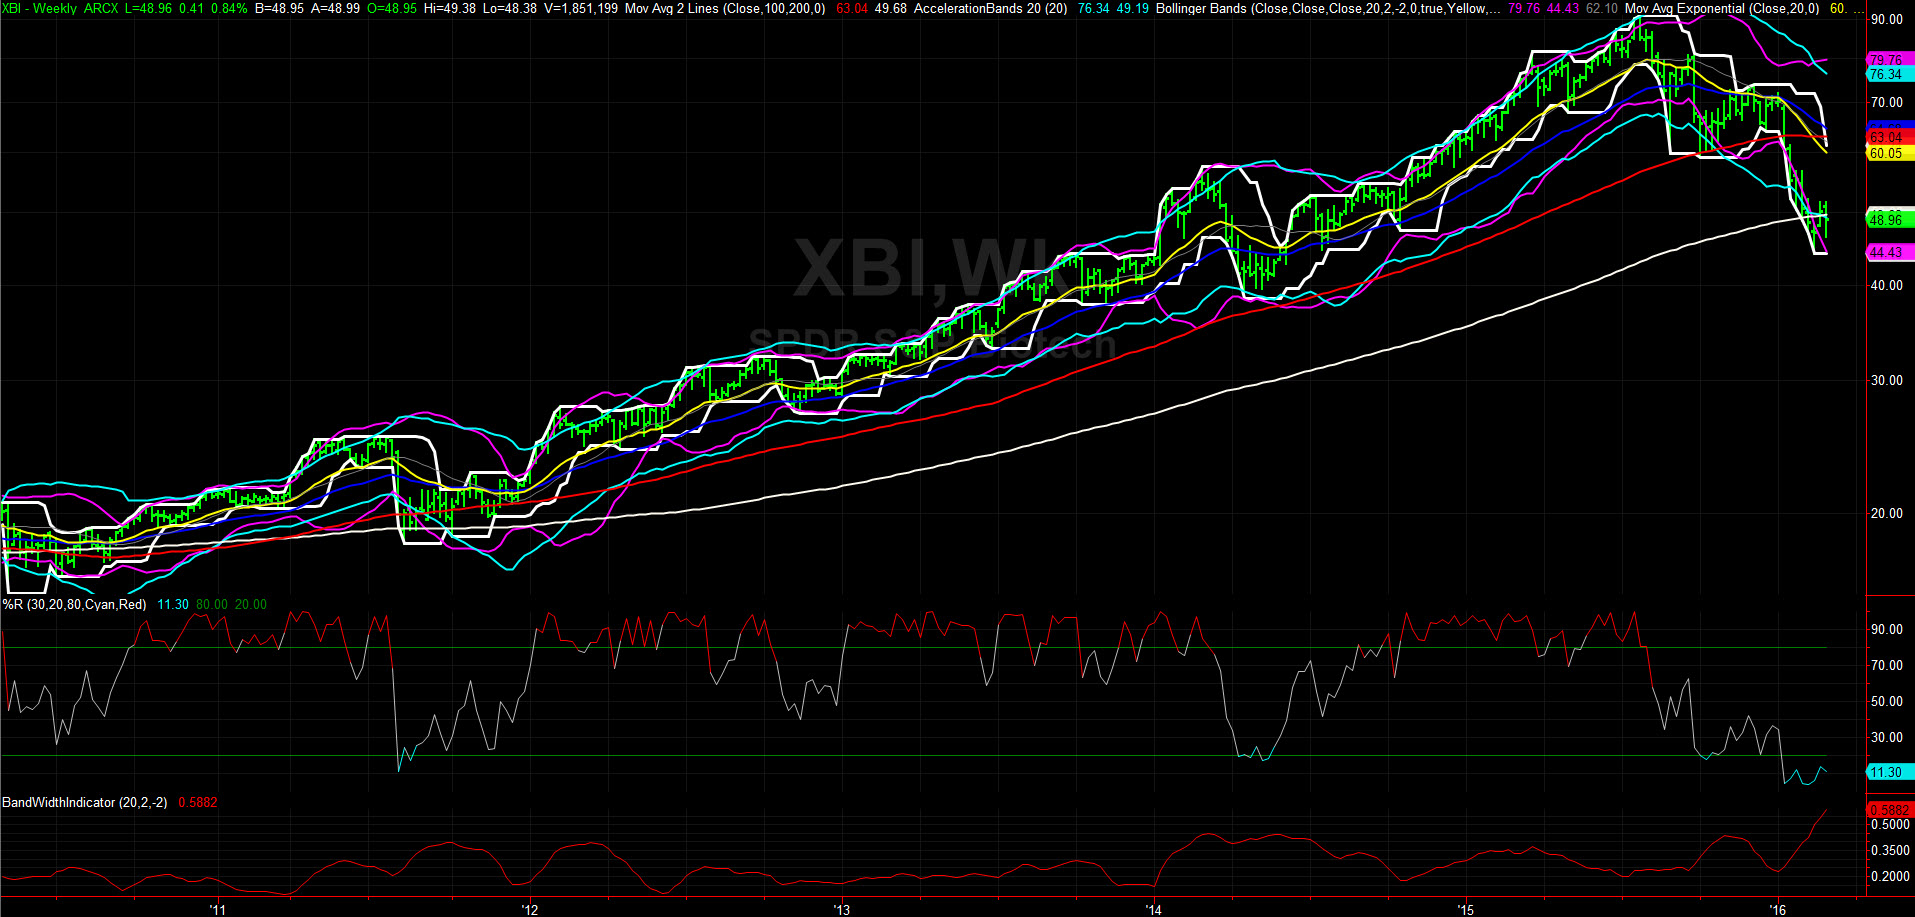
Here you can see the massive upmove that Biotech ETFs had for several years -- this is a pretty clear breakdown of the uptrend. It would be wise here to look at various long-term support lines, moving averages and Fibonacci Retracement levels (a common one is a 50% retracement of a key low to a key high) to see targets of where the ETF may find support. Often in this type of move (pullback following a consistent uptrend), the security may chop around sideways in a trading range before resuming the uptrend.
Will the laggards of 2016 outperform the market in the remainder of the year? Will the early leaders fall back? This is uncertain at this time, but watching shorter-term Daily/Hourly charts and Relative Performance vs the SPY and other broad market indices over recent key market pivot points is a way to see what ETFs & sectors will reap gains and losses going forward.
by Moby Waller,
co-Portfolio Manager, ETFTRADR & Rapid Options Income
BigTrends.com
1-800-244-8736