Bearish Chart Pattern Seen In NYSE Composite
"Two Thirds of the Time This Pattern Leads to Lower Stock Prices"
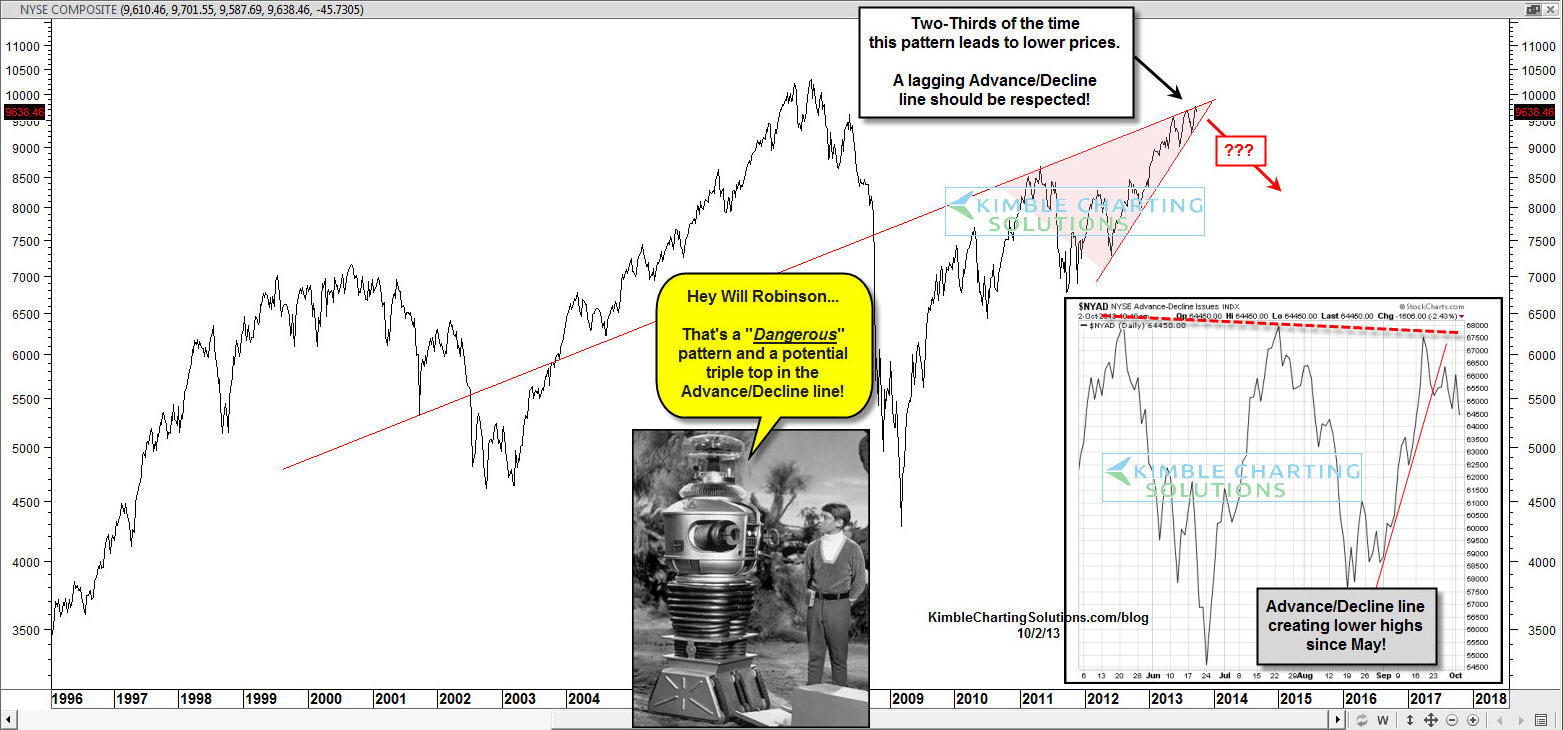
Historically, Bearish rising wedge patterns lead to falling prices about two-thirds of the time. [BigTrends.com Editor’s Note: the author cites no source data to back that first % statement up. However, narrowing wedge formations often tend to precede volatile directional moves in our experience. But remember, this is a long-term Weekly chart shown below, not a short-term one.] The NYSE composite has created a bearish rising wedge that is about to come to an end.
At the same time this pattern is coming to completion, the Advance/Decline line shows that a divergence is taking place, meaning that the A/D line peaked in May and has been creating a series of lower highs.
With the A/D line diverging and reflecting weakness, the odds increase that the bearish rising wedge will have an impact on this broad index.
 [1]
[1]
Courtesy of Chris Kimble, Kimble Charting Solutions, advisorperspectives.com [2]