Trading is a funny business. It's deceptively simple – buy low and sell high. Yet, in an effort to find and manage successful trades, the conversations inside your head can be deafening, not to mention distracting. Far too many traders talk themselves out of good trades, yet justify sticking with bad ones.
There's a cure for these trading blues that most veterans in the business know well. The key is using an approach that helps you find opportunities that aren't already overcrowded. And, the best way to do that is taking cues for the more subtle, less-watched nuances of a stock (or index's) chart. One of our favorite overlooked tools we use for this purpose is the directional movement index, or DMI for short, which we just used to lock down more than a 100% gain on half of a position in some Amgen (AMGN) calls.
But, first things first.
The directional movement index indicator can seem intimidating on the surface, particularly when you're using all the data it offers. But, it's not all that complicated. It just needs a straight-forward explanation, with some visual examples to help lay out what's what.
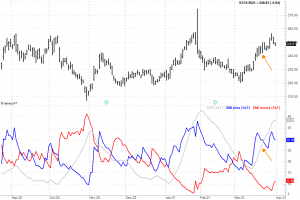
On the graphic below we've plotted a daily chart of Amgen with its directional movement index indicator, which in our case plots three different but related lines. The blue line is positive directional movement index, or DMI+. This line simply plots the average change in Amgen's high for the past, in our case, 14 days. Conversely, the red line is the negative directional movement index, or DMI-. It plots the average change in Amgen's daily lows for a particular timeframe. Again, for the purpose of our example, we're just looking at the past 14 trading days.
 [1]
[1]
Generally speaking, these two lines move in the opposite direction… as they intuitively would. A stock making higher highs usually does so at the same time it's making higher lows. Higher highs push the DMI+ line upward, but higher lows push the DMI- line downward. And, vice versa. You can readily see on our chart that the red DMI- line rises when Amgen shares are falling, while the DMI+ line falls. This is a new way of identifying budding trends without necessarily using the closing price (as is typically the case with most indicators).
The real star of the show here, however, is the average directional index — or ADX — plotted in gray.
The simple explanation: ADX is the average difference of the two DMI lines. This "smooths out" some of the deceptive daily volatility of the DMI lines to help us spot a true trend. But, more important, helps us identify the beginning (or end) of a trend. When the ADX line starts to rise, that's a sign that the two DMI lines are in a sustained divergence… a clue that a solid trend is taking shape. When the ADX line is falling, it's a clue that the two DMI lines are converging, which is the sign of a weakening trend or even a reversed trend.
The catch? A rising ADX line can be bullish or bearish. While the bullish trend we caught with our Amgen calls coincides with a rising ADX line, so did the stock's pullback in October. That would have been just as good of a trade, even if a bearish one.
And now knowing what it is, it's easy to look back and see the opposing ebb and flow of the two DMI lines coincide nicely with Amgen's rise and fall, particularly when the ADX line started to rise. That rise took shape when the trends first started to take shape, even though DMI/ADX is (theoretically) a lagging indicator. Changes in highs and lows seem to start taking shape before major price swings do, or at least around the same time. That's important for momentum traders like us.
This particular trade was made in our Grand Slam Options trading service, which uses — among other tools — the DMI indicator as a key trade-finding tool. It's not the only one we use for the service, nor is the 14-day average for our DMI lines the setting we use for these picks. (Sorry, but that sort of information is proprietary, as is our tweak of the DMI tool.) We do apply the indicator in the straightforward way it was meant to be interpreted, however, with consistently encouraging results.
If you'd like to benefit from our use of the directional movement index and average directional index indicators and see them in action, take a look at our Grand Slam Options service. The Amgen win was just one of many.