Oil’s long-term trading average is crossing above its short-term average, charts show
By Mark DeCambre, MarketWatch [1]
After taking a beating over the past several months, crude-oil prices may be turning a corner, with a bullish chart pattern crystallizing in recent trade.
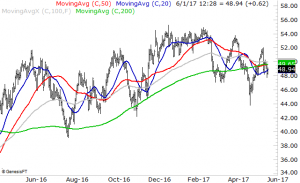
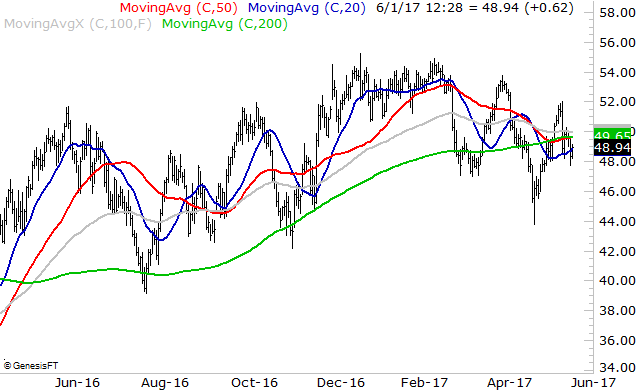
A so-called golden cross, which occurs when the long-term trading average of an asset crosses above its short-term average, has begun to form in West Texas Intermediate crude trading on the New York Mercantile Exchange. Oil was trading 1.6% higher at $49.12 a barrel on Thursday.
In this case, WTI’s 200-day moving average of $49.64 a barrel was pushing above the 50-day moving average at $49.59, according to FactSet data. A relatively narrow trading stretch by crude in recent months resulted in both trading averages converging, putting oil prices up in a position to tilt into a either a bullish or a bearish trend. A cross of oil’s 50-day moving average below its 200-day moving average would have signaled what chart watchers describe as a “death cross,” or negative trading momentum.
 [2]
[2]
Market technicians tend to pay attention to the relationship between short- and long-term price patterns to help determine an asset’s upward or downward momentum.
To be sure, crude futures’ fairly tight trading range still signals that oil could be marked by volatile swings in the coming weeks and months.
Recent activity in crude, which has weighed on the S&P 500 index (SPX) nd the Dow Jones Industrial Average (DJIA) comes as the U.S. Energy Information Administration reported Thursday that domestic crude supplies fell by 6.4 million barrels for the week ended May 26, marking a two-month stretch of falling stocks.
That may be good news for oil bulls because surging U.S. output has raised some concerns that a pact led by the Organization of the Petroleum Exporting Countries and other major oil producers to curb production hasn’t been entirely effective. Since an OPEC meeting in Vienna last week, investors have tried to shake off their disappointment that oil producers, who agreed to extend output-limits ending this month to March 2018, didn’t enact more aggressive measures to curb output. Oil has settled in the red in four of the past five trading sessions.
Meanwhile, the energy sector, consisting of oil-related companies heavily influenced by the price of oil—as measured by the exchange-traded Energy Select Sector SPDR ETF (XLE) — has been the worst performer among the S&P 500’s 11 sectors over the past three months, down 9%.
So, a bit of optimism in the charts may be a welcome thing for investors, even if it proves ephemeral.
From MarketWatch [3]