Traders should never assume anything, but that's especially true right now. Last week's meltdown was for all intents and purposes unheard of, and stocks were vulnerable to be sure. But, unlike most knee-jerk selloffs, this one was actually somewhat rationalized. If the coronavirus does indeed turn into a full-blown global contagion, the economy could be up-ended and stocks could be in trouble.
Still, assuming this isn't the beginning of the end of the world, there were several pieces of market-related data we saw reach levels last week that usually coincide with a capitulation. In more familiar terms, a major bottom results from a rush of unjustified selling. Know that if you're betting on more downside, you're betting against historical norms.
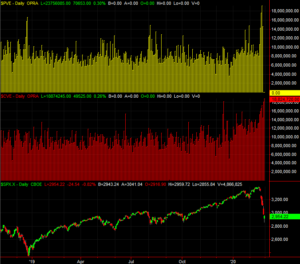
As is so often the case, a picture says a thousand words. Here's a graphic of all four.
Strong Selling Volume, Then Strong Buying Volume
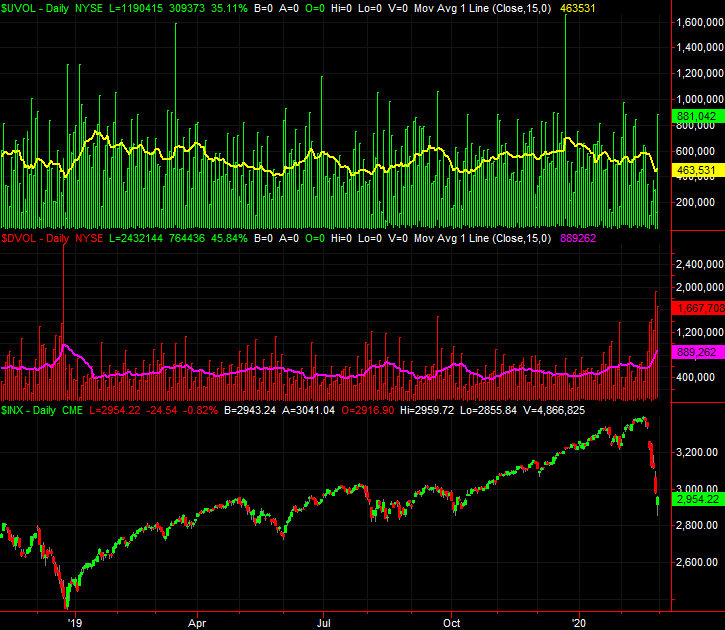
Although the indices finished Friday still in the red and we saw a ton of bearish volume behind the move, we actually saw a bearish volume reach multi-month highs on Thursday (DVOL, red). Bullish volume was pretty solid on Friday (UVOL, green), as a whole lot of stocks were benefitting from the bargain hunters' buying.
 [1]
[1]
It matters, and if you want to know why, just look back to what happened in late 2018. The bottom and subsequent pivot into an incredible uptrend started with a bearish volume surge immediately followed by an impressive improvement in buying volume.
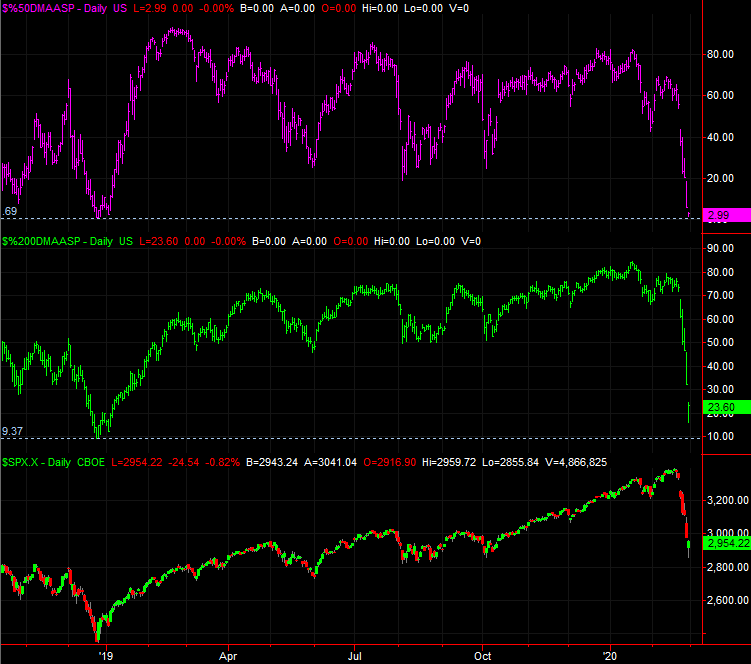
Stocks Above 50, 200 Day Moving Average Lines Plummet
It wasn't quite to the extent we saw it happen in December of 2018, but perhaps only because they didn't have time to make the moves. Either way, the number of S&P 500 stocks that are now trading above their 50-day moving average lines (pink) is a paltry 3%, and the number of S&P 500 constituents still trading above their 200-day moving average lines (green) is a rather low 23.6%. The former matches the December-2018 level, and while the latter one doesn't, again, the selloff has only lasted seven days. The 2018 meltdown got going in October, giving the market several weeks to get most stocks below their pivotal 200-day moving averages.
 [2]
[2]
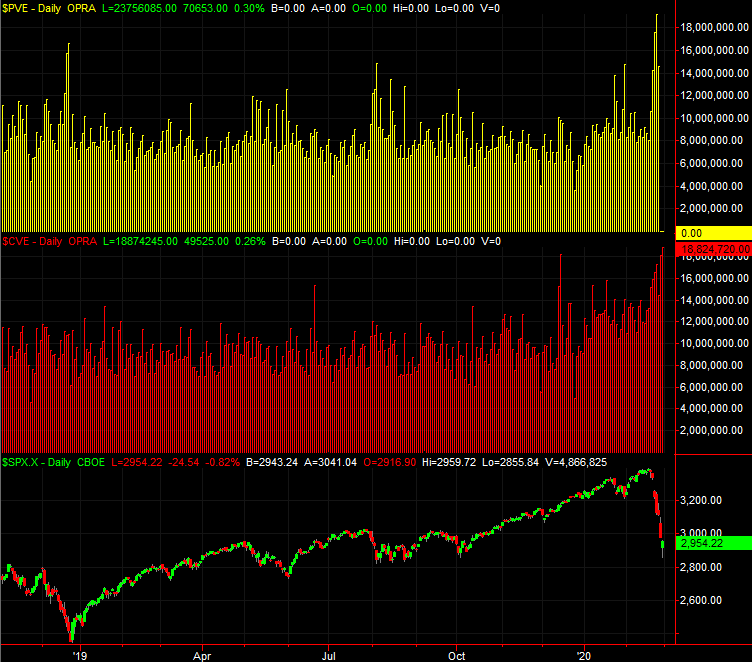
Put Buying Spikes to Multi-Year Highs
We like to look at put option and call option buying interest as a measure of trader sentiment, though not for the straightforward reason. In that the crowd is most wrong when it thinks it's most right, a lot of put buying (bearish bets) suggests a bottom is near if it's not already been made.
That was certainly the case back in December of 2018 when put buying on equities reached a multi-year peak right as the market was hitting a major low. Yet, on Thursday (although Wednesday's read was a multi-year high until Thursday) the purchase of equity puts — as market in yellow — spiked to unprecedented levels. What's different this time around is how many equity call options were purchased last week, plotted in red. This strong level suggests a huge number of traders is actually counting on a bounce… something we didn't see take shape at the very end of 2018. Ideally, nobody should expect a bounce if it's going to happen.
 [3]
[3]
Somehow though, this much bullishness (or at least a willingness to make bullish bets) says there are a lot of bulls out there waiting in the wings. That's actually bullish as well, just as the spike in put buying is.
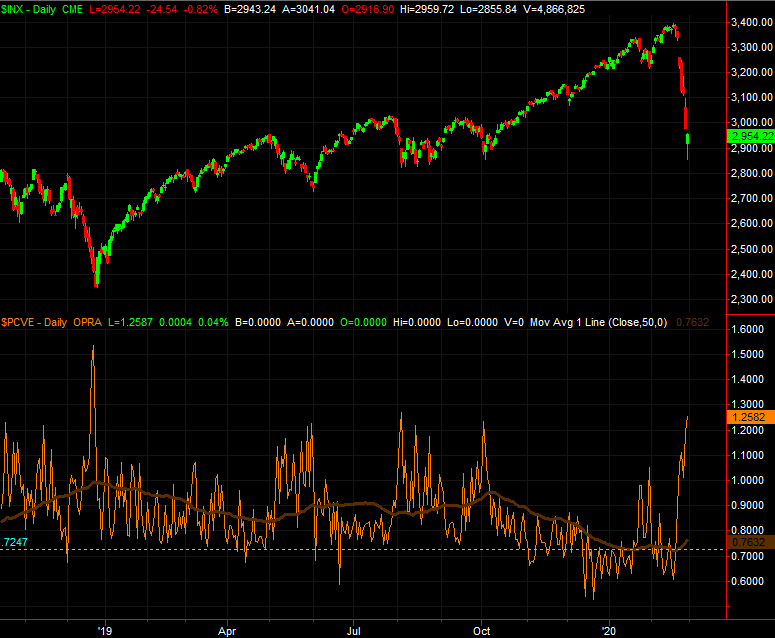
Put/Call Ratio Soars to Multi-Month High
Finally, and in the same vein as the raw put-buying data, the put/call ratio didn't rival its December-2018 level, but it got close last week, and is revisiting values seen in August and October that coincide with pretty good market bottoms. The put/call data here is on the bottom of the chart, in orange, compared to the S&P 500 on top.
 [4]
[4]
The interpretation of the put/call ratio (equity products only… no indices) is the same as the interpretation of the total put-buying data. It's a great contrarian clue, meaning it says traders are most bullish near market tops, and are most bearish near market bottoms. The put/call comparison is simply another way of determining how bullish or how bearish the market's bets are. A little too much put buying interest — compared to call buying in this case — is often seen at major lows, right in front of recoveries.
Bottom Line
Maybe these unusual numbers aren't going to mean what they usually mean this time around. Perhaps traders are absolutely right to be concerned, and smart to be playing this degree of defense.
That's rarely every the case though…. maybe one in twenty times does the market buck the historical tendency. If you're betting that's the case this time around, just know you're betting against the odds in a huge way.