
Wednesday ended up being as wash, with the NASDAQ gaining ground while the S&P 500 lost it. But, all in all traders were likely glad to have a relatively tame (on balance) day that let them catch their breath. It's a chance to take a step back and look at the rally that's unfurled since the March 23rd low.
It's been less-than-thrilling since late last week. It's not been "bad" per se. The key indices remain above pivotal near-term moving averages that should act as support, if tested. But, it's far from ideal for reasons far beyond Wednesday's lethargic action. Three flaws stand out among the rest. In no particular order…
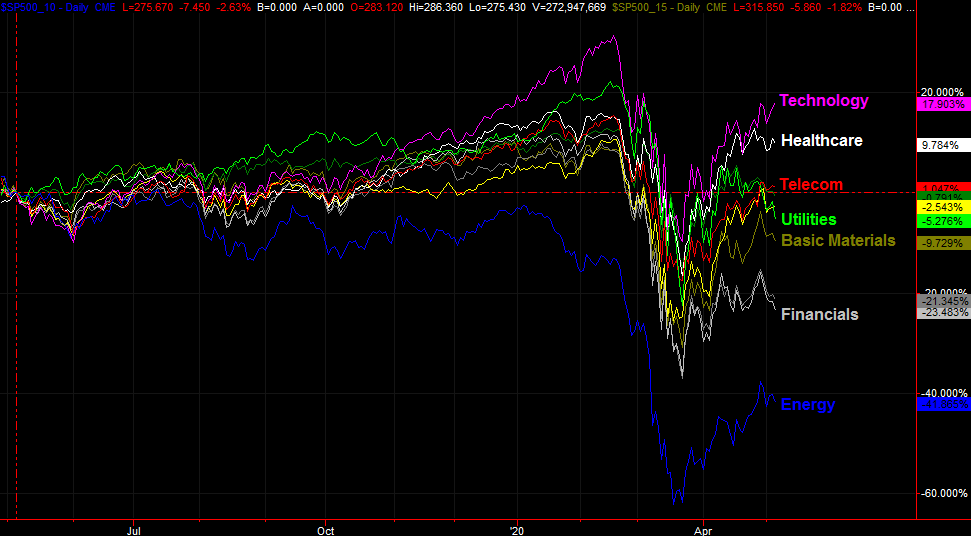
Lopsided Sector Leadership
Sectors don't necessarily rise and fall as the same pace. But, most of them do tend to fall and rise in tandem, with leaders and laggards emerging en route from peak to trough back to peak. Over the course of the past several days, however, we've seen a decided divergence within the sector indices. The tech sector is leading the way, but it's the only one forging ahead. All other sector groups are down (some by a great deal) since late last month.
 [1]
[1]
It matters. It's a matter of participation. One group can lead the way for a while. Indeed, one group can lead an entire bull market. But, one group of stocks can't drive a marketwide rally all by itself. Other sectors will have to help out sooner or later. [In this same vein, it's not even the entire technology sector doing most of the heavy lifting. The FAANG stocks are doing most of the work here. While they may be the market's most important stocks, even they're not influential enough to alter the trajectory for the rest of the stock market.]
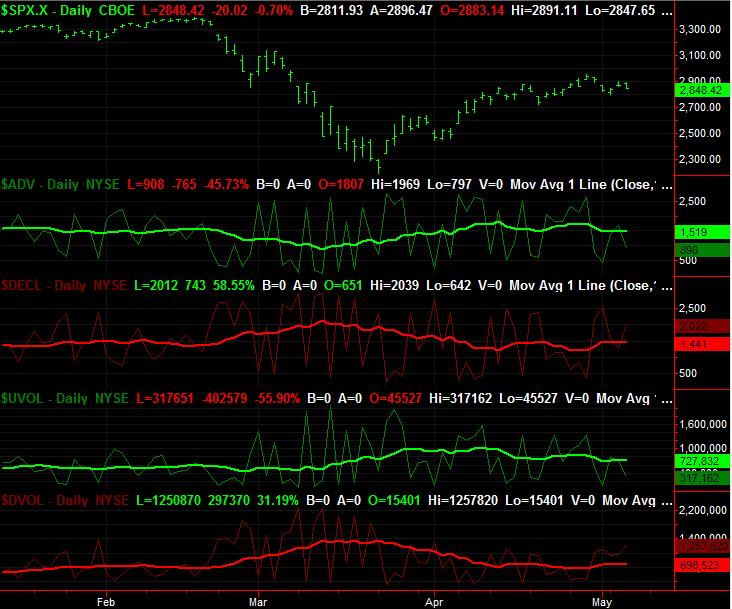
Wrong Volume Dynamic
It's a set of data we look at on a regular basis, but it merits a special mention right now… there's a minimal amount of bullish volume at work here, and that amount of fading. It has been since late last month. In the same way, the amount of bearish volume is firming up, and growing. Ditto for the market's total daily advancers and decliners.
The chart below tells the tale, comparing the S&P 500 to the NYSE's daily advancers ($ADV), the NYSE's daily decliners ($DECL), the S& 500's daily "up" volume ($UVOL), and the S&P 500's daily "down" volume. The daily numbers are the thinner, more erratic lines. The thicker, slower moving lines are the moving averages of that data, which shows the trend, or true undertow. Look carefully and you'll see the green bullish lines are edging lower, and the red bearish lines are inching higher.
 [2]
[2]
This isn't a decisive blow to the market just yet. But, it's a concern. In the same sense a rally needs at least most of the sectors to participate, a rally also needs a persistent bullish volume and a growing number of advancers to persist.
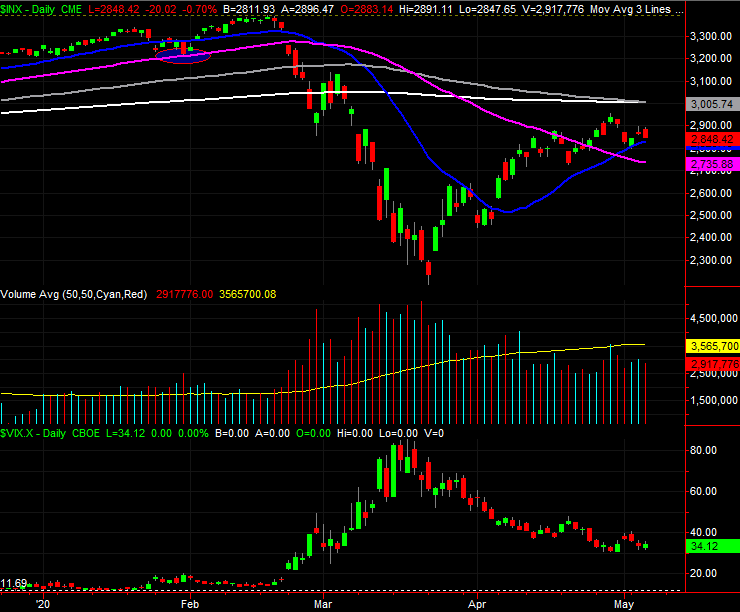
Still Under Major Ceilings
Lastly, although one would expect it to take some time and two or three efforts to make it happen, the S&P 500 is still below a pivotal technical resistance level at 3005. That's where the 100-day (gray) and the 200-day (white) moving average lines have converged. The S&P 500's close of 2848 on Wednesday leaves the index within striking distance, but doesn't suggest the bulls are ready or willing to make the effort yet.
 [3]
[3]
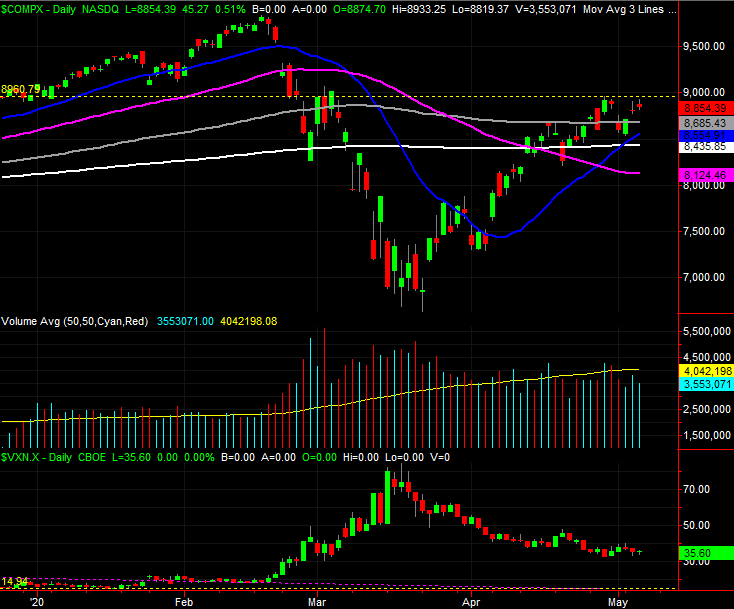
For the record though, the NASDAQ Composite has cleared its most important moving average lines. But, it's not yet hurdled its pivotal technical ceiling at 8960.
 [4]
[4]
Bottom Line
None of it is the end of the world. The buyers may simply be biding their time. All things are cyclical.
It's a concern all the same, however, if only because the ebb and flow cycle of late is being measured in weeks instead of days. In other words, a little slowdown here has better-than-average odds of turning into a more significant setback. Fortunately, there's lots of technical support underneath where the indices currently rest. The worry could be unnecessary. As has been the case for the better part of the past several weeks, we'll just have to wait and see.