If you're a BigTrends Insider, you receive complimentary email each week that contains our featured TrendWatch articles (which we've been publishing since 1999), links to recent articles, notices of upcoming events, and option/investing education. The quick signup box to be a BigTrends Insider is on the front page of the BigTrends.com website.
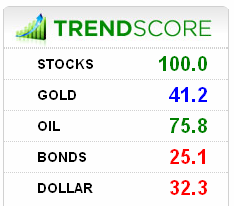
You may also have noticed in the BigTrends email the TRENDSCORE.
What is the BigTrends TrendScore?
The TrendScore is a quick numerical & colorful way to gauge the major trends in the most influential sectors. It evaluates the strength or weakness of major market assets like Stocks, Gold, Bonds, the Dollar and Oil on a daily basis using a proprietary method developed by Price Headley CFA, CMT. The score is calculated based on a comprehensive methodology (primarily composed of our unique approach to Williams Percent R over multiple time frames) and has been proven effective in our Award Winning Market Timing models.
TrendScore evaluates chart patterns using technical analysis while leveraging the power of multiple time frames to score a security from 0 to 100 on a scale of Bearish to Bullish. Using our easy to read red-yellow-green image of ranking you will quickly be able to determine the strength of the prevailing trend and utilize this as a tool for how to position your capital. It also shows the weekly change of each indicator with the same color coding.
The TrendScore was developed using the major exchange traded funds (ETFs) as proxies for timing the underlying asset. For example, for broad market timing we apply the TrendScore to SPDRs S&P 500 ETF (SPY). Here is a list of how we apply the TrendScore to major market assets.
Stock Market Timing: SPDR S&P 500 ETF (SPY)
Gold Timing: SPDR Gold Trust (GLD)
Oil Timing: United States Oil Fund (USO)
Bond Timing: Barclays 20 Year Treasuries (TLT)
Dollar Timing: PowerShares US Dollar Index (UUP)
Readers of our TrendWatch Newsletter receive actionable information in a quick and reliable method from the TrendScore.
3 ways to use the BigTrends TrendScore:
1. Focus buying Bullish trends when the TrendScore is 60 or above
2. Focus on shorting Bearish trends when the TrendScore is 40 or below
3. Find Trading opportunities with TrendScore analysis. When the TrendScore is between 41 and 59 traders should consider a developing shift in the prevailing trend.
The BigTrends TrendScore assists in finding high probability trade set-ups among stocks, bonds, gold, dollar and oil.
'Most traders are seeking reversals in the market of which they never find and in the pursuit they lose precious capital. I've found much more success in defying the common belief using uncommon wisdom. When a stock goes 'overbought' or 'oversold' I found that it continues to remain 'overbought' or 'oversold' for a significant period. In many cases this period includes the biggest trends and that's what the TrendScore identifies.' -Price Headley, CEO and Founder of BigTrends.com
Historically our TrendScore has proven trends in the following:
Red: Levels have been historically bearish with the opportunity to short with fast gains on the downside.
Green: Readings in the Green have been proven to be trending bullish with the opportunity to buy with upward movement.
Yellow: Symbols in the Yellow indicate a trend reversal or a "no-man's land" and we recommend further analysis until a trend develops.
The Trend Score service is free to every trader that receives the TrendWatch Newsletter from BigTrends.com. If you are an active investor, day trader, options trader, or utilize any sort of asset allocation, the TrendScore can help you time assets with higher precision using the proprietary methods developed by the technical innovators at BigTrends.com.
If you have any further questions on how the TrendScore can help boost your profits send us an email [email protected] or call 1-800-244-8736.
Trade Well,
Price Headley

