The Current Market Situation In 7 Charts
The (Not So) Good, the Bad, and the Ugly
by Bespoke Invest
The broad market has held up well over the last two weeks, even as some areas of the market have gotten slaughtered at a rate that we haven't seen in quite a long time. Moves lower of 10%, 15%, 20%, 25% and even 30%+ in stocks that were last year's winners on no news has investors on edge, and rightfully so since it is so out of the norm for this bull market. Investors right now just aren't willing to pay the same premium they were a few weeks ago for expected earnings growth. If the strong, stable blue chip names can maintain their uptrends here, it's not a bad thing for the froth to come out of the areas of the market that had gone parabolic. If not already, then pretty soon all of the weak hands will have been played in these areas. The thing to watch, though, is what the areas of the market that have held up well lately do when the areas that have been weak stop going down. If investors simply shift their selling, the broad market is in trouble.
Below are a few six-month price charts of the major US indices that we track closely.
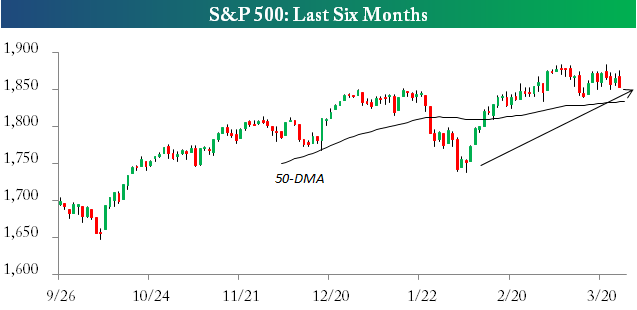
As shown, the S&P 500 (SPX) (SPY) is still well above its February lows and just off its all-time highs. The index remains above its 50-day moving average and it closed today just above the 1,850 level that so many traders are keeping an eye on for support.
SPX Chart
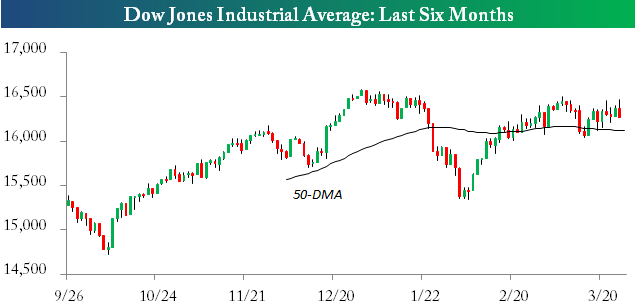
The Dow Jones Industrial Average (INDU) (DIA) had been lagging the S&P and the Nasdaq all year up until the last few weeks, but it has been meandering sideways as growth stocks have tanked recently. As of the close today, the Dow is still above its 50-day, but it also failed to take out its prior all-time highs when it peaked earlier this month.
DJIA Chart
Now on to the bad...
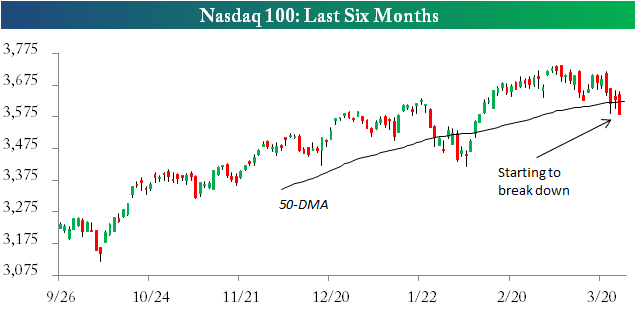
As shown below, the Nasdaq 100 (NDX) (QQQ) broke below its 50-day moving average today for the first time since the pullback that occurred earlier this year. The gains off of the early February lows are quickly eroding, and the break of the 50-day is not a positive technical sign.
NDX Chart
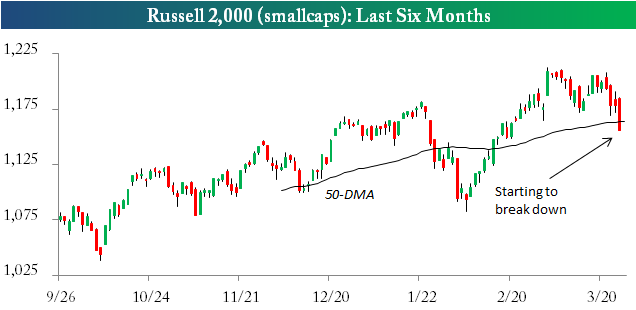
The smallcap Russell 2,000 (RUT) (IWM) also broke hard below its 50-day once again today. Back in January, the index experienced a similar break, and it continued lower by a few more percentage points before it found a bottom.
RUT Chart
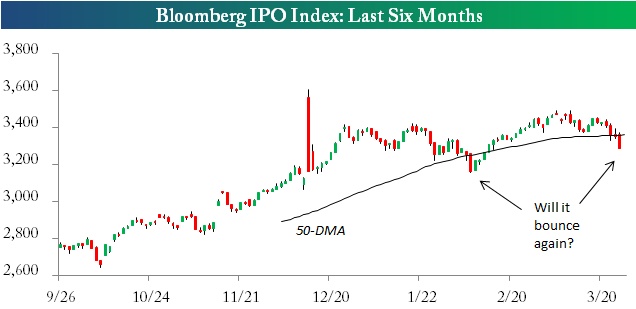
There has been tons of IPO talk lately, but the Bloomberg IPO index that is made up of the companies that have gone public over the last 12 months is showing signs of breaking down. Along with the Nasdaq 100 and Russell 2,000, this IPO index also broke below its 50-day today. Back in February, the break below actually marked a solid bottom for the index. Will it bounce yet again?
IPO Index Chart
Now on to the ugly...
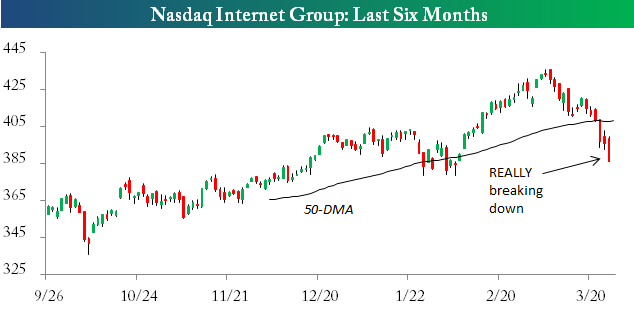
The Nasdaq Internet group (SOCL) (FDN) was one of the biggest winners of 2014, as investors flocked into high fliers like Netflix (NFLX), Pandora (P), Facebook (FB), Twitter (TWTR), Amazon.com (AMZN) and priceline.com (PCLN) to name a few. This is one of the trades that has come unwound over the last few weeks, however, and the last six trading days have just been brutal. The group is currently in extreme oversold territory. At some point it will bounce, but the old adage of not trying to "catch a falling knife" applies here.
Internet Sector Chart
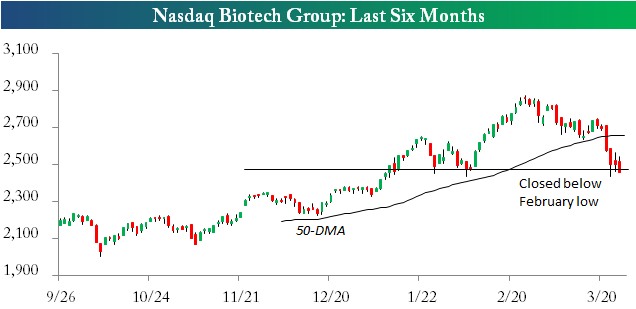
The Nasdaq Internet group has plummeted, but at least it's still above its February closing lows. The same can't be said for biotech. After today's decline -- its sixth down day in a row -- the Nasdaq Biotech group (IBB) (XBI) is now below its closing low made during the January/February pullback. As shown in the chart, the group went straight up from its early February low to its late February high, but it has gone straight down since then. Until we see things stabilize in this group for more than a few days, we would stay far away.
Biotech Sector Chart
Courtesy of BespokeInvest