The Bearish Case, After A Nearly 5 Year Bull Run
The Bearish Case, After A Nearly 5 Year Bull Run
Earnings Season Could Bring The Bear Out of Hibernation
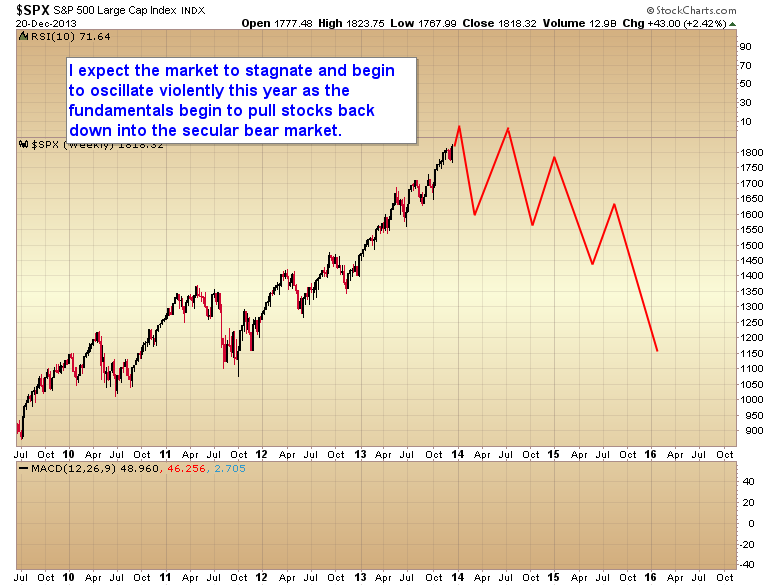
It's been my theory for some time now that this QE driven bull market would top either in late 2013 or early 2014, followed by a multi-month stagnation process as liquidity leaked into the commodity markets.
At almost 5 years this bull market is right up there with the three longest bull markets in history. Sentiment and complacency have reached levels typical of a bull market top.
The Advance-Decline line has started to diverge.
NYSE Advance-Decline Line Chart
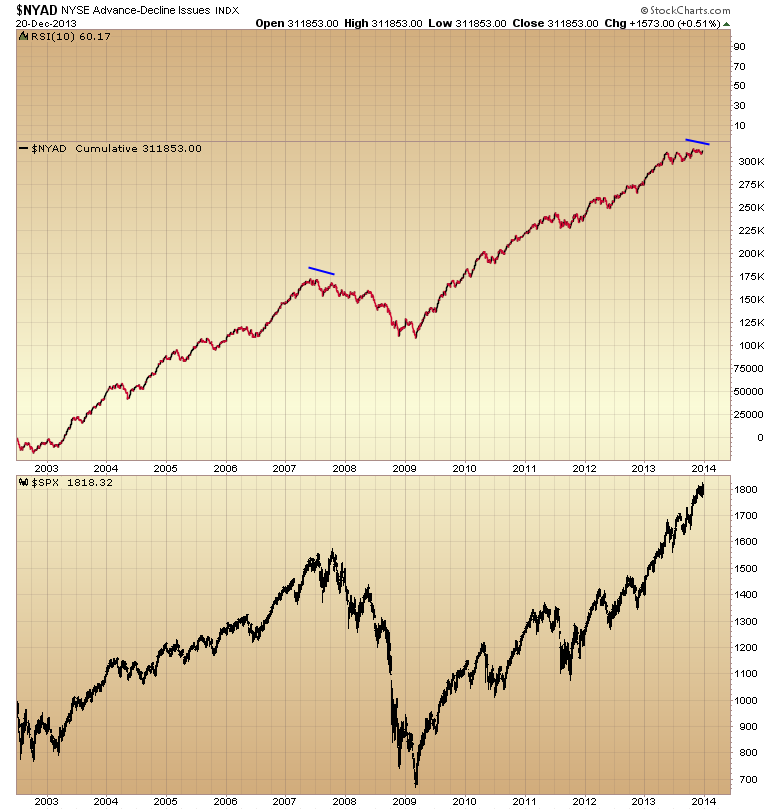
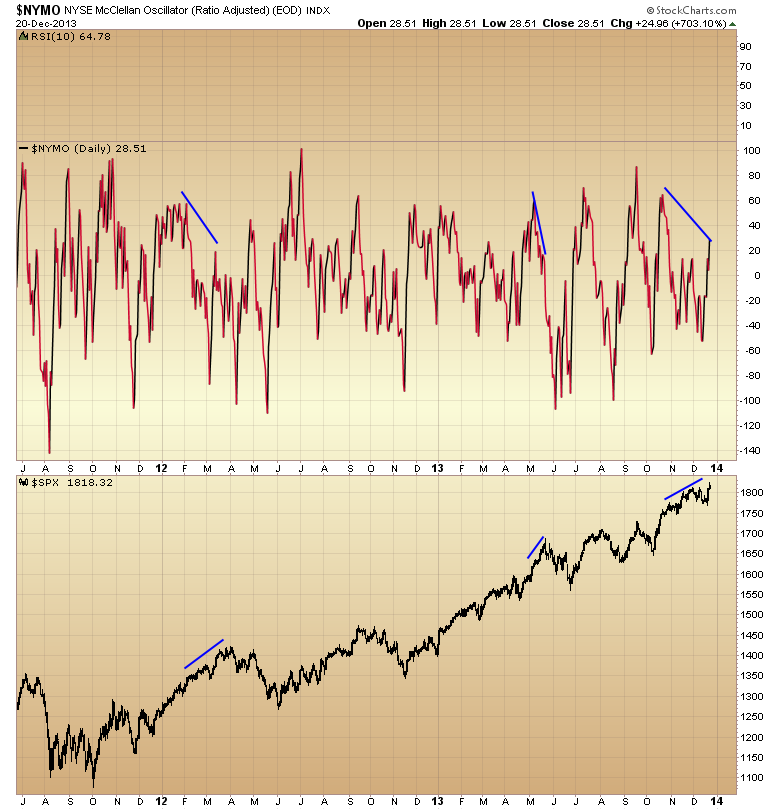
Market breadth is deteriorating. This often happens at intermediate tops.
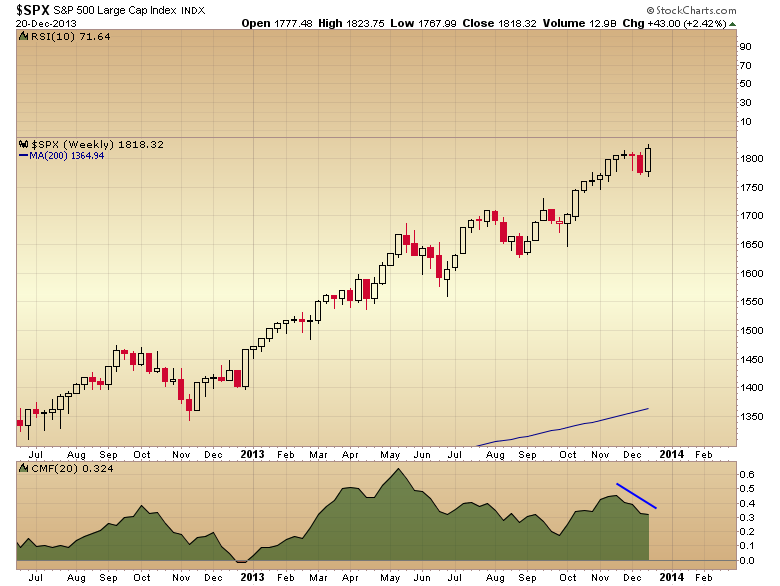
Money flows are also diverging; another warning sign that is often seen at intermediate tops.
Even more concerning is the fact that this intermediate rally will be on week 27 next week. Most intermediate cycles bottom by week 20-24. QE 4 is stretching not only this intermediate cycle, but the previous intermediate cycle before it. This has in effect stretched the market extremely far above the mean, guaranteeing an exceptionally violent decline when this house of cards breaks.
The Fed hasn't done us any favors by artificially pushing the market much higher than it should've gone naturally. All they have done is guarantee an exceptionally severe selloff when the market finally corrects.
We've clearly been in the euphoria phase of this bull market throughout 2013, and I expect this will continue through the end of the year and maybe into the beginning of earnings season. However, I expect we are going to see a very sharp move down in stock prices as we move through January and into early February.
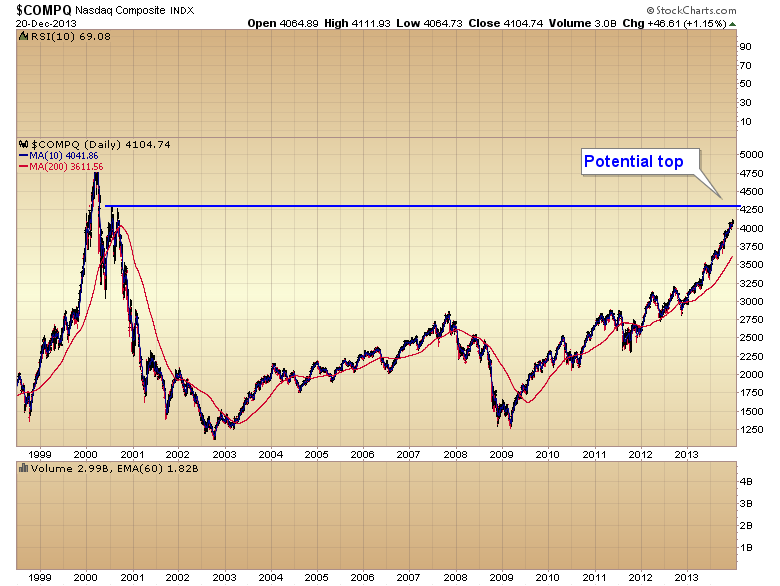
For those inclined to enter short positions or long term put positions in preparation for the next bear market, I think they could do so when and if the NASDAQ Composite (COMP) reaches its initial 2000 recovery high of 4250.
I think long-term 2016 puts on the Nasdaq 100 (QQQ) or S&P 500 (SPX) (SPY) are going to pay off many thousands of percent over the next two years.
Courtesy of Toby Connor, GoldScents

