Key Market & VIX Levels To Watch Now
It's times like these, when the market is very volatile and/or selling off, that it's helpful to look at some relatively stripped-down big picture charts. We can see where we stand, what recent history shows us and what key levels of support may come into play.
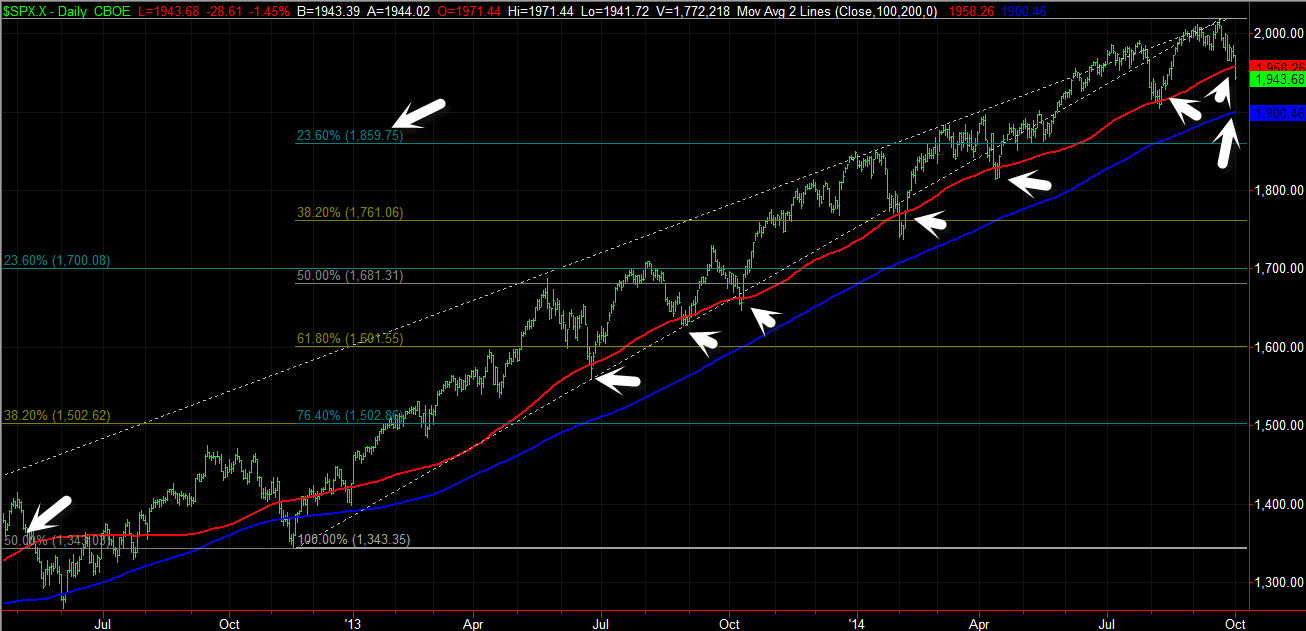
First, the S&P 500 Index (SPX) (SPY) Daily Chart below, with only a Fibonacci Retracement and 100 day & 200 day simple Moving Averages (MA) on it (all charts captured around 30 minutes before the close on Thursday).
SPX Daily Chart
[Charts created with TradeStation]
We've drawn the big picture trend here on the above chart from the late-2012 low, although the early-2014 low could be used as well. This supposes that we reached a key high recently, with the SPX intra-day record high level of 2019.26. The late-2012 low was used because that is last time SPX violated its 200 day MA (it also is right around the 50% Fibonacci Retracement level on the next longer-term chart ... held as support nicely there). Since that time, the SPX has tested and at times mildly violated its 100 day MA 6 previous times (now is the 7th) -- each time, it quickly (few days up to a couple weeks) reversed back higher from this support. On Thursday, we closed well below the 100 day. The rebounds from this trendline must be taken into account before one becomes too all-out bearish here.
The first key support level below this that jumps out is the 200 day MA -- which closed today right around 1900. Big round numbers are important from a technical, sentiment and psychological perspective -- and having the 200 day MA here as well adds to this. 1900 is 2.4% below Thursday's closing SPX price. Beyond that, the first Fibonacci Retracement level over this time frame is 1859.75 -- which is about 4.4% down from here (certainly within reason if the pullback continues and/or accelerates).
Next up is a big picture SPX Weekly Chart, with a Fibonacci Retracement drawn from the March 2009 infamous '666' bottom to the recent high. Weekly Williams Percent R (using inputs & settings from the BigTrends method developed by Price Headley) is at the bottom of this chart:
SPX Weekly Chart
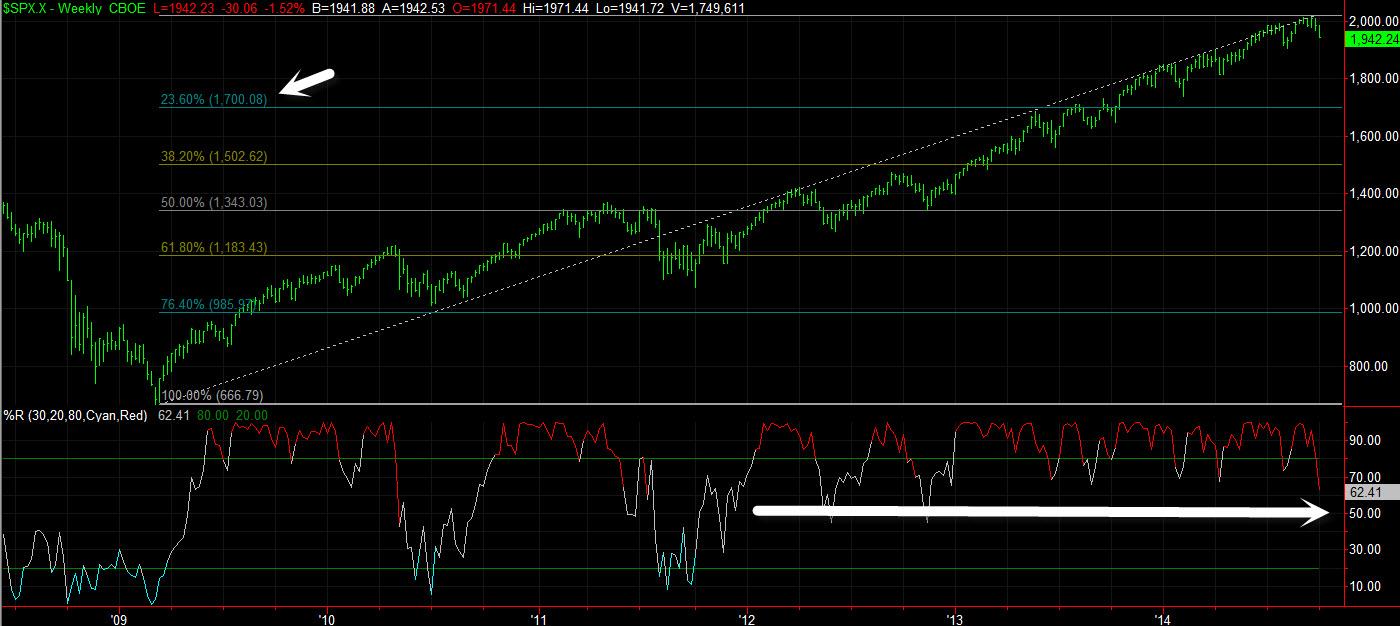
This multi-year chart above shows the strong rally that's been in place for some time now. The Fibonacci Retracement on this gives a downside target all the way down at 1700.08 (basically 1700) -- again, right around a round number and strike price. That is 12.6% below current levels, and would certainly qualify as a legit correction in my book. But before you get too worried about that, take a look at the Percent R readings at the bottom of the chart. Weekly Percent R has been in strongly bullish mode throughout most all of 2012 to 2014. Pullbacks on this indicator have been contained by mid-levels around the 50 area -- and it moved back from higher from there each time (although it can take a few weeks on this longer time frame perspective). Additionally, the last 5 drops from extreme bullish readings above 80 (what could be considered a "bullish re-test") were quickly reversed back higher in line with the market resuming strength -- this current Weekly bar is one of those re-tests (although it is a deeper drop in the indicator than the ones earlier in 2014 and in 2013.
Final chart below is the CBOE Volatility Index (VIX) (VXX) Daily with only horizontal key levels on it. The VIX measures the implied volatility of SPX options -- but also has uses as a measure of sentiment among traders & investors. VIX tends to spike higher on market weakness, uncertainty and when traders are bearish. When everyone is scrambling to buy Puts as protection and to bet on downside, the VIX will tend to spike higher, from supply/demand and other factors. A sidenote rule of thumb on the VIX is that it basically is saying how much the market could go up or down on a % basis over the next 12 months.
VIX Daily Chart
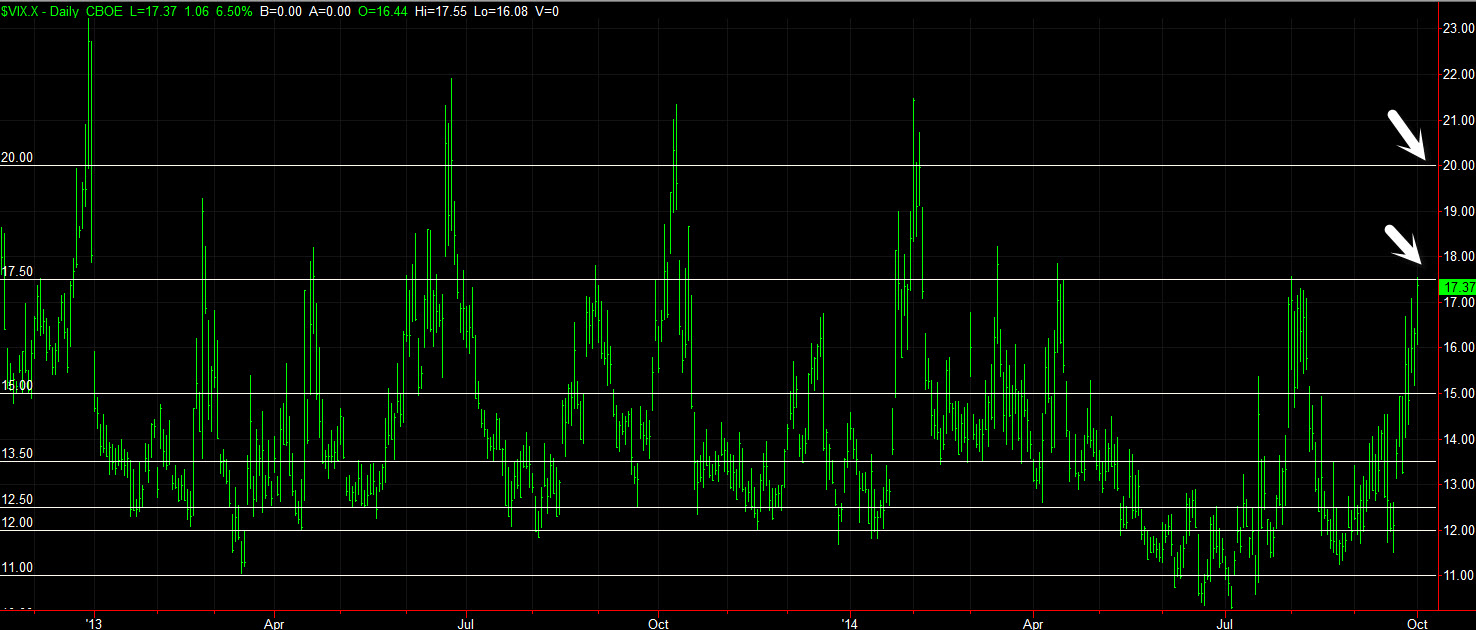
Here above we see that the VIX has reached a key level around 17.50 (again, round numbers are important). Over the past 2 years, spikes in the VIX have generally been capped at 17.5 or 20 -- when these levels have been breached, they have tended to quickly reverse lower in line with the market stabilizing and/or rallying. So what this is showing us here is that option traders are mildly alarmed currently, but not showing a great deal of fear or panic (at least yet).
There is a kind of sidenote question as to whether the VIX is 'smart' or 'dumb' money in general and to whether it is a contrarian indicator to market performance. In my view, the VIX has tended to be smart money in recent years (in the 90s and other times when we studied and utilized VIX as an indicator, it was more of a contrarian dumb money indicator at that time) -- particularly when VIX goes lower in an uptrending market. But the bottom line on this is that 17.5 and 20 have marked peaks in the VIX in 2013 & 2014, usually in line with the market rebounding.
We reached historic Depression-level volatility in 2007 to 2009 during the global economic crisis and the VIX reached as high as 89 -- it doesn't seem as though the global macro economic situation is anywhere near close to that at this point in time. That being said, the picture that has been developing in recent weeks is one of a global (non-US) economic slowdown and structural financial problems. We've seen the Dollar rallying strongly (this was kind of the precursor to this market volatility and now selloff), commodities losing value (including Oil), now money flowing into safety nets such as US Treasury Bonds (TLT). And now some trickles that US economic growth is possibly slowing down a bit, as well. All of this combines in my view to the Fed being more reluctant to raise interest rates -- seems they will want to keep the cheap/free money flow going in an effort to stabilize and boost the global economy, regardless of what Friday's employment report says.
As far as the market, recent history tells us that this selloff should be short-lived and reversed quickly -- but this time could in fact be different, due to the global economic woes and turmoil coming together into a relatively ugly storm. In some ways this reminds me of the Currency Crisis of 1998 (I was a Market Maker on the CBOE floor at that time) -- although a different set of circumstances, that caused the US market to be weak for about 3 months and to lose about 22% from peak high to peak low rapidly, before recovering quickly -- every situation is different, however. If we do break down further, watch those SPX levels listed above on the Daily & Weekly charts for possible support and reversal areas.
by Moby Waller,
co-Portfolio Manager, Rapid Options Income & ETFTRADR
BigTrends.com
1-800-244-8736