Highest SPX Forward P/E Since 2005, Highest Energy Forward P/E Since 2002
Highest SPX Forward P/E Since 2005, Highest Energy Forward P/E Since 2002
Highest P/E Ratio for S&P 500 Energy Sector Since 2002
By John Butters, FactSet Insight
The forward 12-month P/E ratio for the S&P 500 (SPX) (SPY) now stands at 16.6, based on Friday's closing price (2063.15) and forward 12-month EPS estimate ($124.04). Given the high values driving the "P" in the P/E ratio, how does this 16.6 P/E ratio compare to historical averages? What is driving the increase in the P/E ratio?
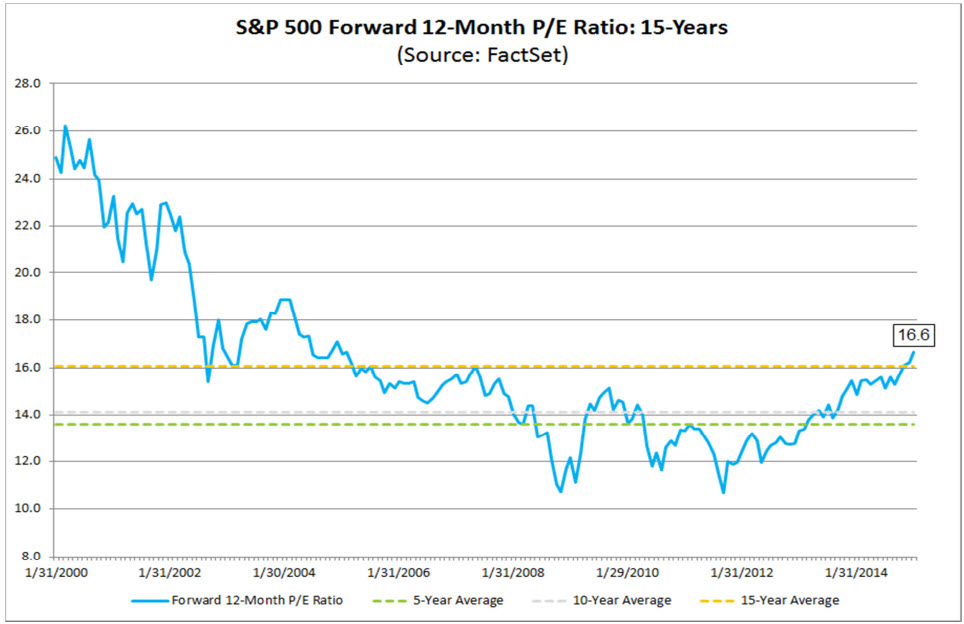
The current forward 12-month P/E ratio of 16.6 is now well above the three most recent historical averages: 5-year (13.6), 10-year (14.1), and 15-year (16.1). In fact, this week marked the first time the forward 12-month P/E has been equal to (or above) 16.6 since March 14, 2005. On that date, the closing price of the S&P 500 was 1206.83 and the forward 12-month EPS estimate was $72.65.
SPX Forward 12 Month P/E/ Ratio - 15 Year Chart

Back on December 31, the forward 12-month P/E ratio was 16.2. Since this date, the price of the S&P 500 has increased by 0.2% (to 2063.15 from 2058.90), while the forward 12-month EPS estimate has decreased by 2.2% (to $124.04 from $126.87). Thus, the drop in the "E" has driven the increase in the P/E ratio to 16.6 today from 16.2 at the start of the first quarter.
What is driving the decrease in the forward 12-month EPS estimate? At the sector level, the Energy sector has witnessed the largest decrease in the forward 12-month EPS estimate of all ten sectors during this time frame. Since December 31, the forward 12-month EPS estimate for the Energy sector has dropped by 27.3% (to $25.69 from $35.35). No other sector has recorded a decline in the forward 12- month EPS of more than 1.6% over this period.
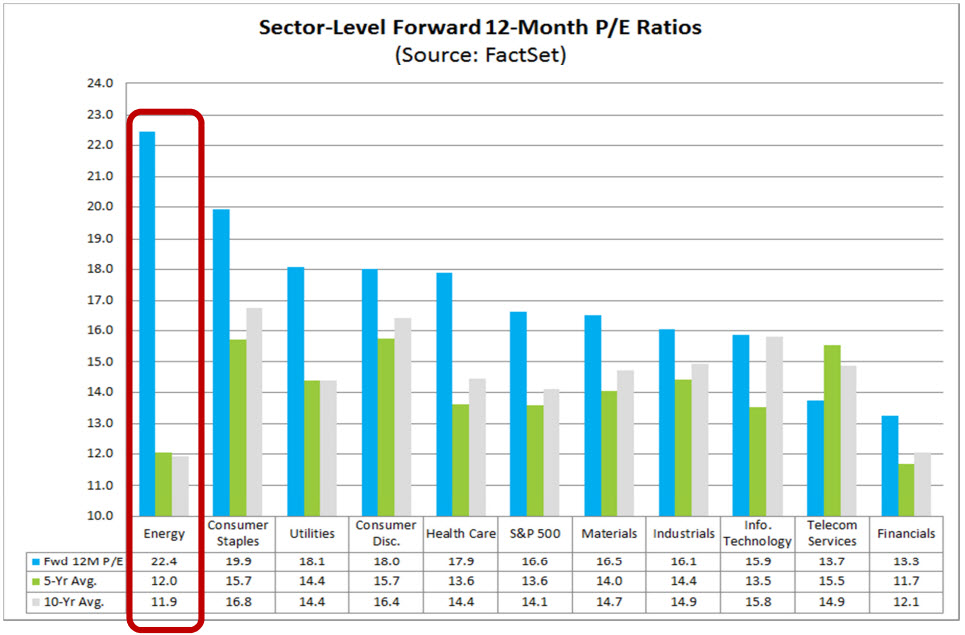
As a result of this decrease in the forward 12-month EPS estimate, the forward 12-month P/E ratio for the Energy sector has increased to 22.4 today from 16.6 back on December 31. The Energy sector (XLE) now had the highest forward P/E ratio of all ten sectors in the S&P 500. How does this 22.4 P/E ratio compare to historical averages for the Energy sector?
The current forward 12-month P/E ratio for the Energy sector is now well above the three most recent historical averages: 5-year (12.0), 10-year (11.9), and 15-year (13.6). In fact, this week marked the first time the forward 12-month P/E for the Energy sector has been equal to (or above) 22.4 since April 8, 2002. On that date, the closing price of the Energy sector was 225.15 and the forward 12-month EPS estimate was $10.05.
12 Month Forward P/E/ Ratios, By Sector

It is interesting to note that despite the decline in the forward 12-month EPS estimate for the S&P 500 (due to the downward revisions to EPS estimates in the Energy sector) over the past few weeks, analysts are still projecting record-level EPS for the S&P 500 for three of the next four quarters. At this time, the Q3 2014 quarter has the record for the highest bottom-up EPS at $30.09. While industry analysts in aggregate predict that earnings for Q1 2015 ($28.35) will be below this record-level EPS, they believe EPS for the S&P 500 will exceed $30.09 in the following three quarters (Q2 2015 - Q4 2015).
Therefore, if analysts were not still projecting record-level earnings over three of the next four quarters (including the downward estimate revisions in the Energy sector), the forward 12-month P/E ratio would be even higher than 16.6.
Courtesy of FactSet Insight: Full FactSet PDF Report On Earnings is here.
