Accurate "Lamy Model" Gives 0% Probability Of An Imminent Bear Market
Forecasting Model Gives 0% Probability Of An Imminent Bear Market
data by Robert Lamy, http://www.theforecastingadvisor.com/
Where the U.S. Stock Market Cycle Is Heading?
The Current Bull Market in Historical Perspective
In three months, the current bull market will be five years old. As of December 2013, the S&P 500 (SPX (SPY) stock price index has risen by 139% from the bottom of March 2009 to stand at an all-time high. The index, however, is only 17% and 22% above the previous pre-bear market peaks of October 2007 and August 2000. Adjusted for inflation, the current level of the S&P 500 index is hardly above the pre-bear market peak of October 2007 but below the pre-bear market peak of August 2000 by approximately 10%.
Table 1 below reports all the periods of bull market for the S&P 500 price index since the end of World War II along with their respective percentage increase (from through to peak) and duration (in months).
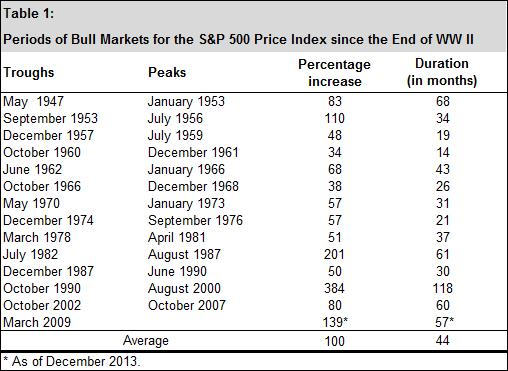
The current bull market, which is still alive, recorded a larger increase and rose for a longer period than most of the previous bull market periods. As of December 2013, the current bull market is the fifth longest and posted the third largest percentage increase. While the duration of this bull market has surpassed the historical average of three years and eight months by more than a full year so far, there is no way to predict how long it will last. But we do know that this bull market will eventually come to an end and a new bear market will arise.
A Brief Review of the Literature on Forecasting U.S. Bear Markets
Following the work of Estrella and Mishkin (Estrella A., and Mishkin, F.S. (1998), "Predicting U.S. recessions: Financial variables as leading indicators", Review of Economics and Statistics, 80, 45-61) on predicting U.S. recessions, there has been a great deal of work on this issue. Considerably much less attention, however, has been paid by economists to forecasting U.S. bear markets.
The first research paper on the subject of forecasting U.S. bear markets was done by Chen (Chen, S.S. (2009), "Predicting the bear market: Macroeconomic variables as leading indicators", Journal of Banking and Finance, 33, 211-223). He evaluated the usefulness of various economic indicators (industrial production, unemployment rate, inflation rate, yield curve, short-term interest rate, monetary aggregate, and government debt) in forecasting bear markets. He found the yield curve and the inflation rate to be the most useful predictors.
Chart 1 below depicts the evolution of the U.S. yield curve (spread between long-term and short-term interest rates) since 1955 with the bear market periods. Not surprisingly, the yield curve is negatively sloped (short term rates rise above long-term rates) in advance to the start or during most of the bear markets.
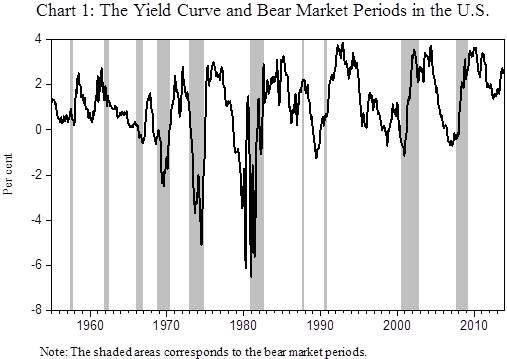
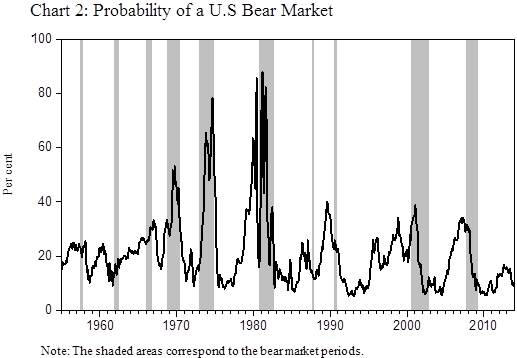
Chart 2 below plots the probabilities of a U.S. bear market from January 1955 to December 2013. The probabilities are obtained with the so-called static probit model approach. The yield curve is the single explanatory variable in the model. Based on the usual 50% threshold to forecast a bear market, the obvious conclusion is that the yield curve is not a strong predictor. Indeed, the yield curve failed to forecast seven of the ten bear markets since 1955, including the severe and long downturn of 2007-2009. The Chart also shows that the probit model produces very low probabilities during these seven bear market periods. The bottom line from this exercise is that the yield curve will not provide a reliable signal forecast for the next U.S. bear market. Additional economic information will have to be taken into account when evaluating the risk of a future change in the state of the stock market cycle.
Nyberg (2013) investigated the predictability of U.S. bear and bull stock markets for the period of 1957 to 2010. He showed that, in addition to the yield curve and the inflation rate, stock market returns and the dividend-price ratio provide significant useful information in predicting bear and bull market periods. His research paper also reveals that the capacity to predict bear and bull market periods increases when the lagged state of the stock market cycle or lagged value of a bear market indicator (i.e., the estimated probabilities obtained with a static probit model) is included as an explanatory variable in the probit model.
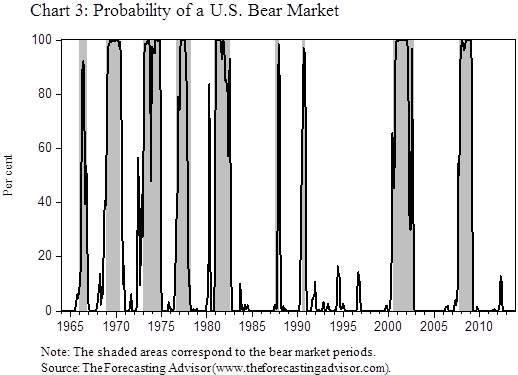
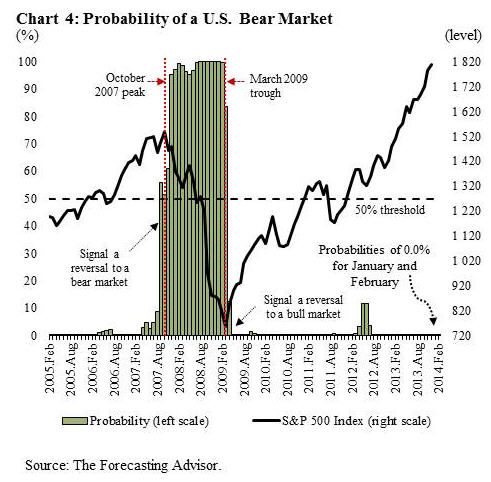
The last research paper was done by Robert Lamy from The Forecasting Advisor (Lamy, R., (2013), "Forecasting the stock market cycle in the U.S", The Forecasting Advisor (www.theforecastingadvisor.com)). He used the static probit model approach to estimate the probabilities of a U.S. bear market for the period of January 1964 to December 2013. The model includes a number of U.S. economic indicators as explanatory variables, such as lagged values of a coincident index of economic activity, the unemployment rate, the inflation rate and the price-to-earnings ratio. The lagged state of the stock market cycle or lagged value of a bear market indicator is not included in the model. Chart 3 reveals that the model performs well in predicting all the bull and bear market periods over the past fifty years. Based on the 50% threshold, the percentage of correct forecasts given by the model is 91% for all the bear market months between 1964 and 2013 and 98% for all the bull market months.
Short-Term Outlook for the U.S. Stock Market Cycle
The Lamy model is used here to assess the risk of a change in the state of the U.S. stock market cycle in the coming months. More specifically, the model provides the probability of being in a bear market for a forecast horizon of one and two months.
Thus, and as shown in Chart 4 below, the model estimated probabilities for January and February are at zero per cent. In other words, the model predicts that the current bull market will extend through February and will very likely reach in March its sixtieth months in duration, matching the length of the 2002-2007 bull market.
Courtesy of Doug Short, http://advisorperspectives.com and http://www.philstockworld.com