Weekly Market Outlook - Stocks Are Just Spinning Their Wheels
The market (well, the S&P 500 anyway) tried all week long to get over a key technical hump, but it just didn't happen.... unless you're talking about the NASDAQ Composite, in which case it did happen. Of the two indices, that's the one you want to lead. Sooner or later though, the S&P 500 will have to follow through. It hasn't yet, calling into question just how real the NASDAQ's rally is
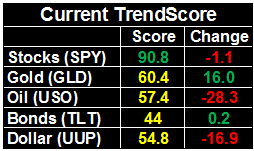
Still, the BigTrends TrendScore for stocks IS a solidly-bullish 90.8. That's down a little from the prior week's score, but still plenty strong.
We'll look at both indices in detail below. First, let's explore last week's economic numbers and preview what's in the pipeline for this week.
Economic Data
There was a fair amount of economic news from last week, but only two items worth diving into - producer price inflation (if nothing more than a preview of this week's consumer inflation report) and December's retail sales.
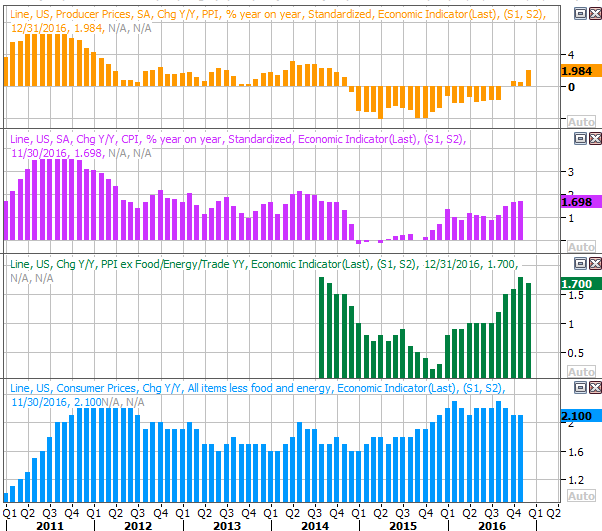
Producer price inflation was up 0.3%, as expected, overall, and higher by 0.2% when taking food and energy out of the equation. On an annualized basis, producer inflation jumped to 1.98%, which is right at the Fed's target rate for consumer inflation. Note the size of the jump though. If this rate of increase is the shape of things to come, the Federal Reserve is going to have to do something to quell it... soon. Even without food and energy the annualized PPI rate is getting "up there."
Producer and Consumer Inflation Rate Charts
Source: Thomson Reuters
This week's consumer inflation report will either underscore or question last week's producer inflation report. The CPI figure (annualized) is already on the rise too, though, and toying with the Fed's target rate. If consumer inflation jumps anything line producer inflation did, the Fed's plans for two to three rate hikes announced in December may look like a genius, future-seeing decision.
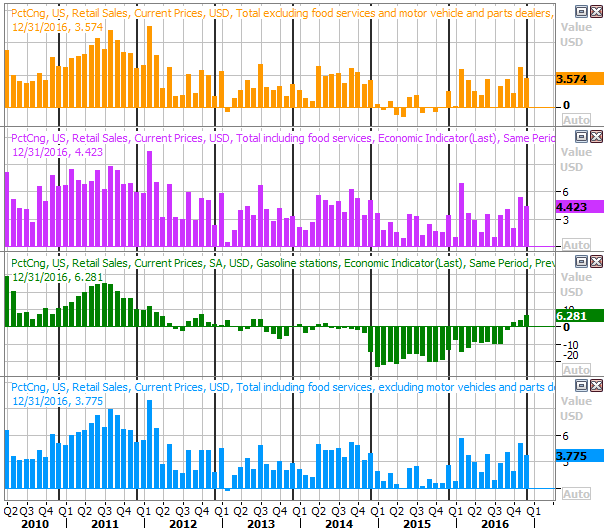
December's retail sales were also great.
The figures touted by news sources were the month-to-month numbers, which is fine, but our year-to-year comparison chart below is even more telling. Not only were December's retail sales growth figures decidedly positive, but the growth pace is starting to trend higher again... in all stratifications.
Retail Sales Growth (YOY) Charts
Source: Thomson Reuters
Everything else is on the grid.
Economic Calendar
Source: Briefing.com
This week is going to be roughly as busy, with the aforementioned consumer inflation on the way, along with capacity utilization and industrial productivity, and then December's housing starts and building permits.
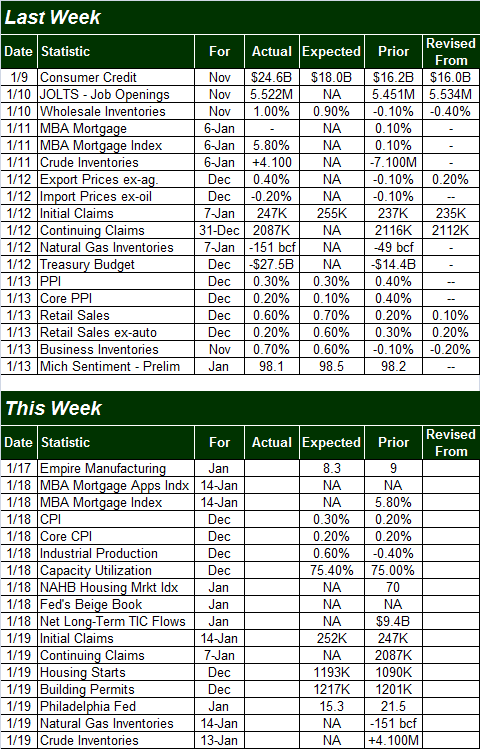
The chart of consumer inflation rates was with the producer price inflation, and therefore doesn't need a preview - consumer inflation is apt to be trending higher as well. No preview is needed. We do, however, want to preview last month's capacity utilization and industrial productivity report. Both are drifting lower, and could use a shot in the arm. Granted, most of the reason for the scale-back is the demise of oil, and that may be about to change. It's not all about the meltdown of oil prices though. We need some help here, and soon.
Industrial Productivity and Capacity Utilization Charts
Source: Thomson Reuters
Note that nationwide corporate profits have fallen in five of the past six quarters, coinciding with the rollover in capacity usage and productivity. Fundamentally, the bull market needs to see a turnaround for both data sets.
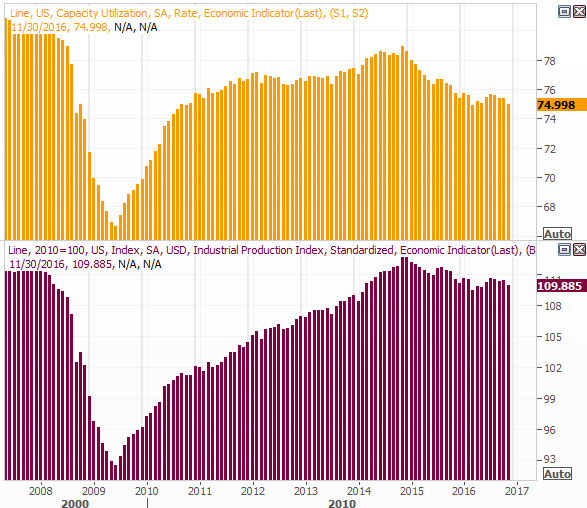
Finally, look for last month's housing starts and building permits on Friday. This has been a surprising bright spot for the economy, even if an uneven one. We have no reason to think the trend ended in December, even though some of the recent chatter regarding some of the homebuilder stocks.
Housing Stars and Building Permits Charts
Source: Thomson Reuters
Index Analysis
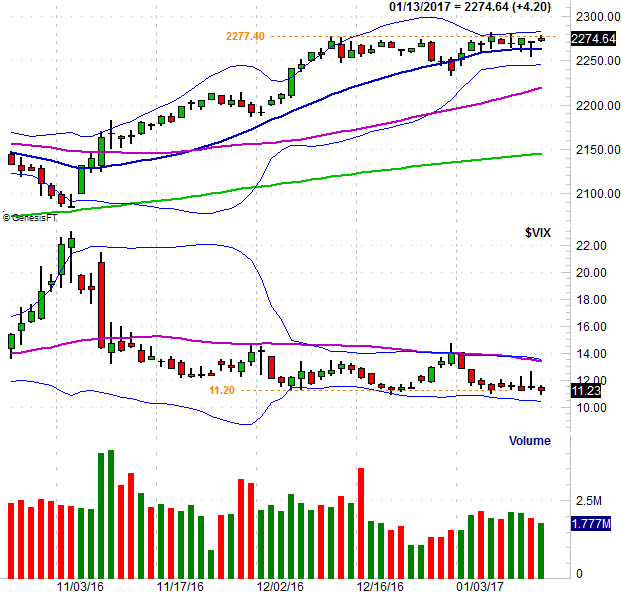
Let's just start at the beginning... with a look at the daily chart of the S&P 500, which best lays the foundation for handicapping the market here. Try as it might, the index just couldn't get over the horizontal ceiling at 2277; one has to wonder if the upper 20-day Bollinger band also played a role in keeping the rally capped. Though the VIX edged a little lower, it too seems to be finding support at a well-established floor around 11.20.
S&P 500 Daily Chart
Chart created with TradeStation
The daily chart of the NASDAQ Composite look a little more different, and a little more bullish. It's pushing ahead to new highs. Of the two indices, this is the one the bulls would want to see lead. Sooner or later though, the S&P 500 will have to follow suit if the rally is to last. And, as you can see on both charts, the bullish volume hasn't been spectacular of late. [It's been average, but not great.]
NASDAQ Composite Daily Chart
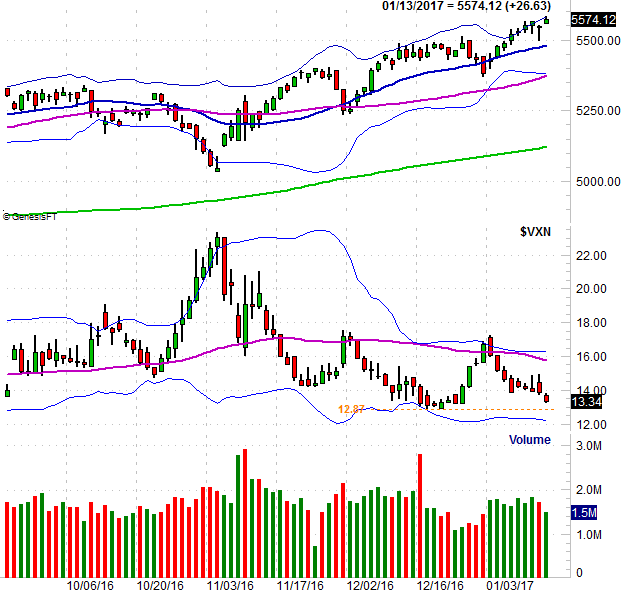
Chart created with TradeStation
Zooming out to a daily chart of the S&P 500 doesn't help us a whole lot. We can see a meandering uptrend, but it's in this timeframe we can also see the index has already bumped into the upper edge of a rising trading zone (red, dashed), and has slowed already. It's also in this timeframe we can see the VIX's floor at 11.0 is a major floor, that extends back to 2015. The situation doesn't preclude more bullishness, but it certainly doesn't make it easy.
S&P 500 Weekly Chart
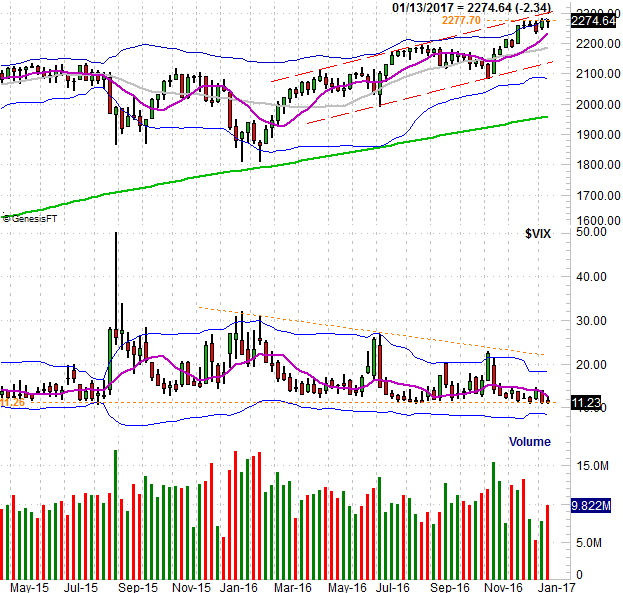
Chart created with TradeStation
A look at the weekly chart of the NASDAQ Composite also looks about like you think it would... bullish. It's in this timeframe, however, we can also start to question how much more time is left for the rally. We just poked above the upper 26-week Bollinger band. That's unusual. It's not unusual to test it, but it is unusual to push above it. Technically it's a bullish clue, but realistically, it may well represent the proverbial "last hurrah" for what's become an overbought move. The NASDAQ is up 32% just since February of last year.
NASDAQ Composite Weekly Chart
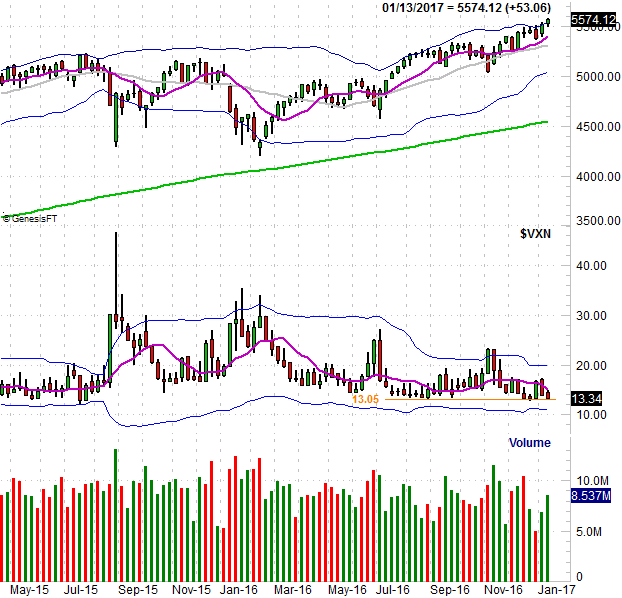
Chart created with TradeStation
This is very much a 50/50 proposition... a coin toss. The market is overbought, overvalued, and ripe for a pullback that common sense says could materialize any day now. Yet, traders are also well aware the market can and will do crazy things, and the usual post-inauguration response is several days of bullishness followed by a pretty sizeable pullback.
Those two things may, in fact, work together. That is to say, while the rally may be difficult to trust right now, a little more bullishness may convince investors sitting on the fence that all is well, lure them in, and then lower the boom when they least expect it by giving us the usual February pullback; the average performance of the S&P 500 for the month is a slight loss.
Just be ready for anything. The good news is, the market's lines in the sand are pretty well defined.