Yields Continue To Fall Despite Looming Fed - Weekly Market Outlook
Yields Continue To Fall Despite Looming Fed - Weekly Market Outlook
Stocks were on pace to close last week out with a gain, thanks to Wednesday's and Thursday's big rebound. But, solid news on the employment front sent stocks lower on Friday, and into the red for the week. Still, the bulls were just strong enough to hold all the major indices above a key line in the sand, maintaining hope that stocks may find their way out of this lull and renew the bigger uptrend soon.
We'll examine exactly how the bulls are hanging on to hope below, after a deeper inspection of last week's key economic figures.
Economic Data
Last week was chock-full of economic announcements, though there's no denying Friday's employment snapshot took center-stage. It was, broadly speaking, good. The unemployment rate fell from 5.8% to 5.6% for December, and 252,000 new jobs were created. Both were better than expected. It's also worth noting it wasn't fortuitous math that pushed the unemployment rate down. More people now have jobs than did a month ago, and fewer people are unemployed.
Employment Trends Chart
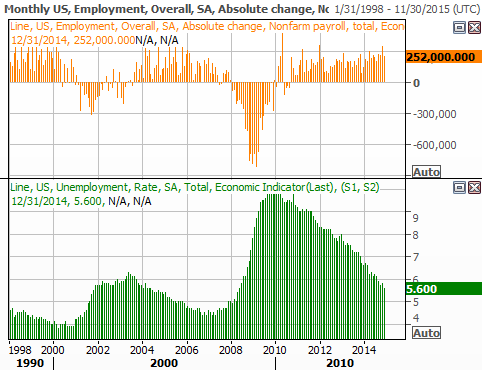
Source: Thomson Reuters Eikon
While the overall employment trend is pointed in a positive direction, note that hourly earnings actually fell a bit last month, suggesting a little lingering slack in the labor market. In other words, the employment situation may not be quite as heroic as the headlines suggested. Still, progress is progress.
Last month's Federal Reserve meeting minutes were released on Wednesday, though it didn't turn out to be an eventful unveiling. The gist was (and this is a quote from those minutes), "Based on its current assessment, the Committee judges that it can be patient in beginning to normalize the stance of monetary policy." Most economists interpreted it as message that interest rates won't be pushed higher at least until April.
The coming week is going to be a busy one, with December's inflation, retail sales, and industrial productivity in the lineup. Between those three market-moving data nuggets in addition to the beginning of earnings season - not to mention the market itself being on the bubble - this week could turn out to be rather wild ride.
Economic Calendar
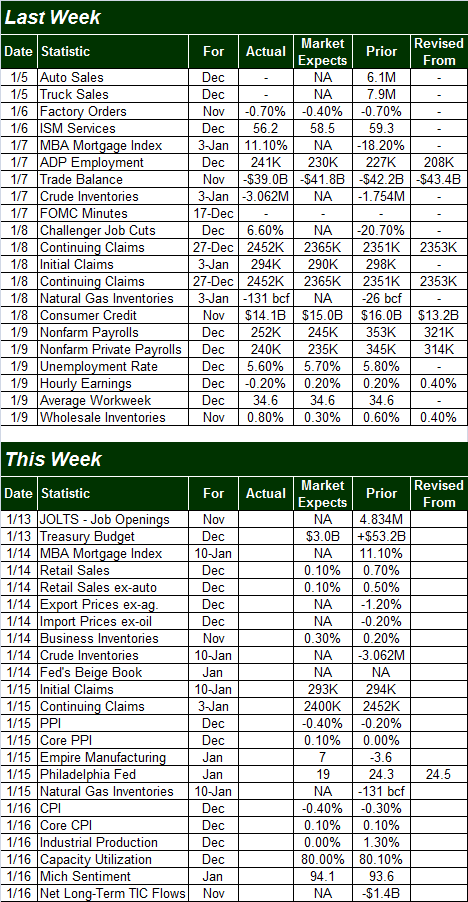
Source: Briefing.com
Stock Market Index Analysis
While we can no longer say the bulls are decisively in control, it's not like the bears have firmly taken charge. The momentum and scenario are just one stumble away from a small pullback, but as has been the case for a while now, even a small pullback doesn't necessarily have to be the beginning of a bigger pullback. In fact, there's a lot of reason to expect a small dip to be halted and reversed rather quickly, if it materializes at all.
We'll focus on the S&P 500 (SPX) (SPY) here, though know that the same pros and cons apply just as well to the other indices. In any case, as is evident on the daily chart of the S&P 500 below, while the rally effort from Wednesday and Thursday fizzled out on Friday, it's interesting that the index didn't close below the now-converged 20-day and 50-day moving average lines.
S&P 500 & VIX - Daily Chart
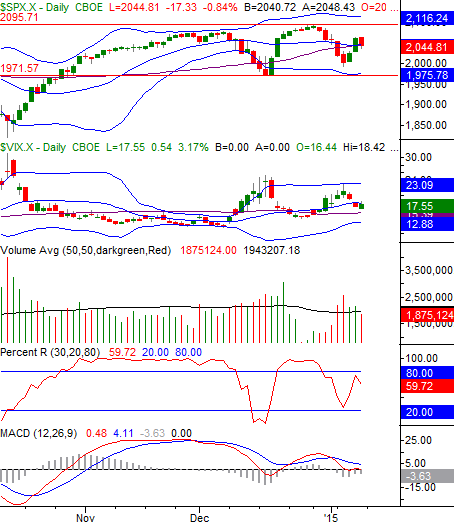
Chart created with TradeStation
Have the bulls decided to make a stand there at 2045? It looks like it, which means we have to give the benefit of the doubt to the uptrend at least until we get a close below 2045. That being said...
While the uptrend may be standing on its last leg, on other fronts it's already showing uncomfortable degrees of weakness. Namely, the Daily PercentR indicator is no longer above 80, and is pointed downward again as of Friday (although our longer-term BigTrends TrendScore is still in bullish territory for the time being). Simultaneously, the MACD indicator lines on the above chart are both sloped downward, with both lines close to moving back below the zero level [MACD lines below zero are a nuanced bearish sign in addition to a bearish MACD divergence].
So we're bearish? Not quite yet, but close. One more weak day will turn the short-term momentum tide to the downside. It's crucial to understand, however, that based on recent history, even the onset of a new bearish trend won't inherently be the beginning of a bigger-picture meltdown.
As evidence to that end, one only has to look at the mid-December and early January pullbacks, both of which were alarming at the time, but neither of which went anywhere.
The CBOE Volatility Index (VIX) (VXX) ended last week at 17.55 -- mildly elevated and showing some concern among option traders, but back within the broad 12 to 18 range that has been in place for some time now.
Although it's subject to change, even if a selloff does get started this week, the 1971 area could bring a quick end to it. That's where the S&P 500 bottomed in mid-December, and it's about where the lower 20-day Bollinger Band is now. Just for the record, however, the index may not even need to slide that far to find a floor. A look at the weekly chart below reveals why.
Take a look. With the one exception in mid-October, the 26-week moving average line has served as a floor for the S&P 500 since early 2013. In fact, the index verified the 26-week moving average line is a support level just last week, by touching it and immediately turning higher. That line currently rests at 2001.
S&P 500 & VIX - Weekly Chart
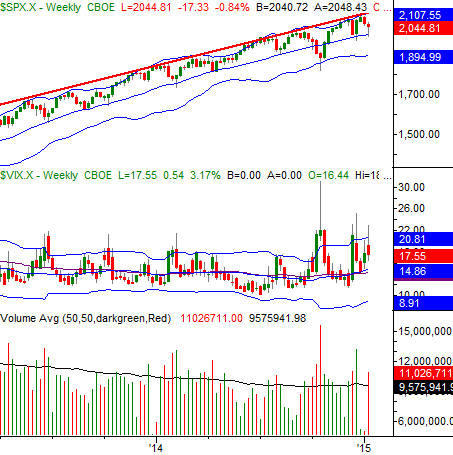
Chart created with TradeStation
Should the floor at 2001 break, then look to 1971. If the 1971 floor fails, then we'll look to the weekly chart's lower band line at 1895 as a floor, like it was in October.
These are all big "ifs", of course. With Friday's close above the key short-term moving average lines, the technical uptrend is still intact. A close above last week's high of 2046 would give some much-needed firmness to the rally effort, however. And, a close above the record high of 2093 would really light a new fire under this old rally.
Bonds & Yields Aren't Aligned With the Fed's Comments
As was noted above, the Federal Reserve discussed raising interest rates last month, and decided - more or less - that it wasn't going to start cranking up rates at least until April (or later). The advent of higher rates isn't anything new, however, and most have accepted it's going to happen sooner than later at some point in 2015.
Yet, the market isn't putting its money where its mouth is, so to speak.
While the looming rise in interest rates should preemptively push rates on existing bonds higher now, and simultaneously push bond prices lower, we continue to see quite the opposite. The 10-20 Year Treasury Bond Fund (TLH) continues to increase in value, while yields on the 10-year Treasury continue to slip, hitting 1.971% on Friday.
20 Year Bond Prices/Yields - Weekly Chart
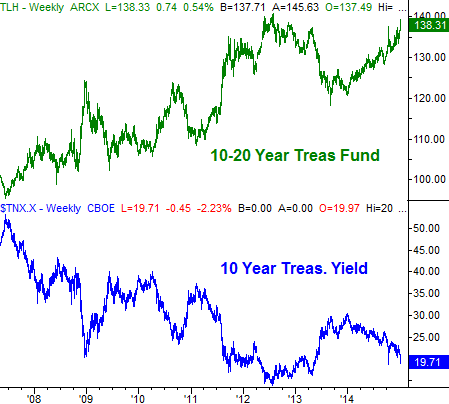
Chart created with TradeStation
How are yields falling and bond prices rising even when the Fed is talking about raising rates within the next few months? It's the market's way of saying it doesn't believe the Federal Reserve is going to raise rates anywhere near as soon as it says it might, more worried about economic red flags (like falling wages) than it's letting on. In fact, the bond market is pricing bonds as if the Fed isn't going to push rates upward until 2016 (or only a small amount in 2015) .... a notion that aligns with the chart above.
Trade Well,
Price Headley
BigTrends.com
1-800-244-8736