Will The Breakout To New Highs Stick This Time? - Weekly Market Outlook
Will The Breakout To New Highs Stick This Time? - Weekly Market Outlook
The S&P 500 Index ended last week at a new high, and the technical trend momentum picture is bullish. But we've seen similar moves since February reverse several times, as the market has remained in a choppy and grinding narrowing range (with a mild upside bias).
The $64,000 question: Do we trust the move we just got by taking it at face value, or is this another potential fakeout? We'll weigh the odds below, after taking a detailed look at some of last week's and this week's economic numbers.
Economic Data
While the economic dance-card was pretty full last week, not much of the data has hard-hitting. The portion of it that was heavy-duty stuff, though, wasn't encouraging.
For instance, the pros were looking for a little measurable progress on the retail sales front. Overall retail sales were flat in April, versus expectations of a 0.2% improvement. Retail sales without automobiles were only up 0.1%, compared to an expected 0.2% increase. And no, we can't blame lower oil/gasoline prices for the weakness. Consumers are (still) basically keeping their purse strings drawn fairly tightly; May's surge was an exception to the recent norm.
Retail Sales Chart
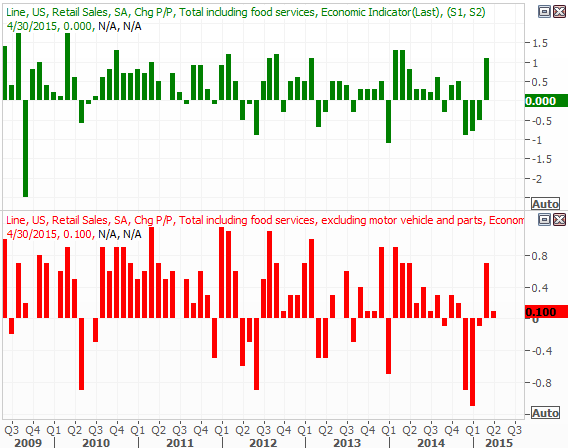
Source: Thomson Reuters Eikon
Last week's surprisingly low producer price inflation rate casts a shadow of doubt on this week's upcoming consumer inflation data. Producers saw a 0.4% decline in their overall input costs, versus a forecast for a 0.2% uptick. Core producer inflation (without food and energy) fell 0.2%, versus an expected 0.2% rise. On an annualized basis, we're now seeing deflation for producers. Though the lull in oil prices is the reason for the swing to a deflationary environment, even without the slump in volatile food and energy prices, prices/costs are very weak, suggesting a lack of pricing power.
Producer Price Inflation Chart
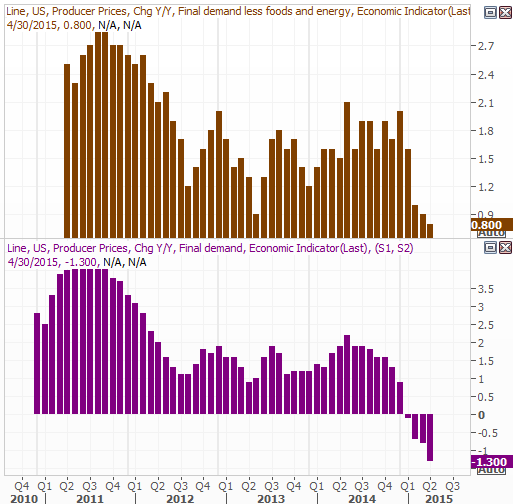
Source: Thomson Reuters Eikon
If last month's producer inflation data is any indication of what's in store for this Friday's consumer inflation report, then the Fed need not be in any hurry to raise rates - inflation isn't anywhere near running rampant.
Last but not least, capacity utilization and industrial production continue to fade. Capacity utilization fell from 78.6% to 78.2%, and industrial production fell another 0.3%. Both readings came in lower than expected.
Capacity Utilization/Industrial Production Chart
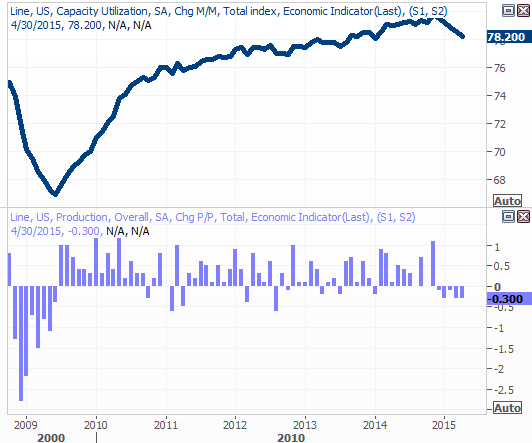
Source: Thomson Reuters Eikon
While the developing trends are ugly, know that waning oil-drilling and refining is being pegged as the bulk cause of this weakness.
Everything else is on the following grid:
Economic Calendar
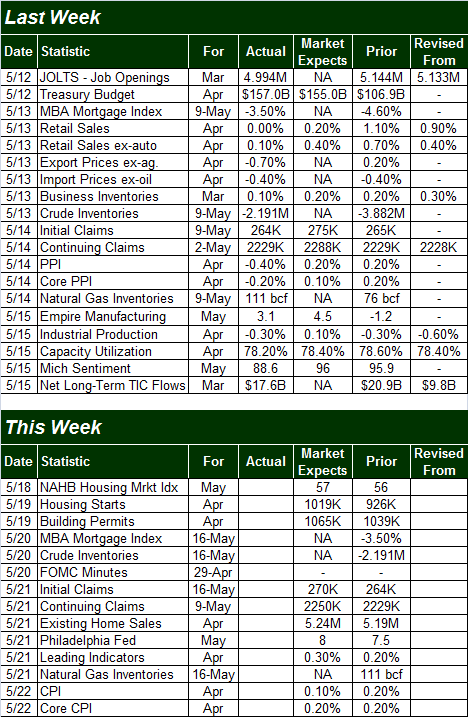
Source; Briefing.com
This week is going to be a little lighter in terms of economic news, though it's going to be a huge week for real estate and construction data. The party gets started on Tuesday with last month' housing starts and building permits, though we'll get the existing home sales report on Thursday. Both housing starts and building permits are expected to tick higher, to 1.0919 million and 1.065 million, respectively. Meanwhile, existing home sales are projected to edge up just a bit, from a pace of 5.19 million to 5.24 million.
Not that these trends have been "bad", but we could use a little progress on all three fronts.
Housing Starts, Building Permits, Existing Home Sales Chart
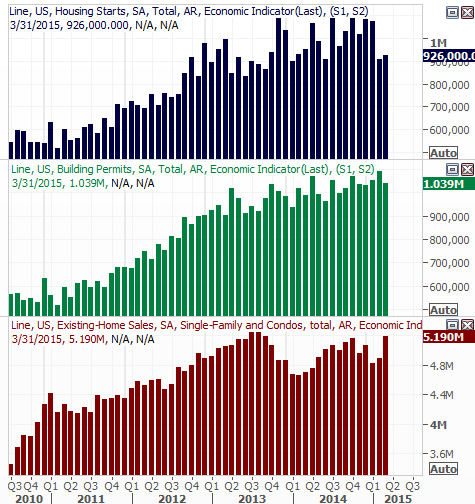
Source: Thomson Reuters Eikon
Also remember we'll get last month's consumer inflation report on Friday.
Stock Market Index Analysis
It may not have been a bold, bullish thrust, but the market's key index - the S&P 500 (SPX) (SPY) - has finally cleared a major line in the sand after three months of trying. The 2118.5 level, which has capped all the major rally efforts since February, was hurdled on Thursday, and that feat was extended on Friday when the S&P 500 closed at 2122.73.
And from a technical perspective, we have little choice but to assume this trend is the real deal. As our chart shows, we also have a bullish MACD indicator, and the Percent R indicator crossed back above 80 and into bullish territory.
S&P 500 & VIX - Daily Chart
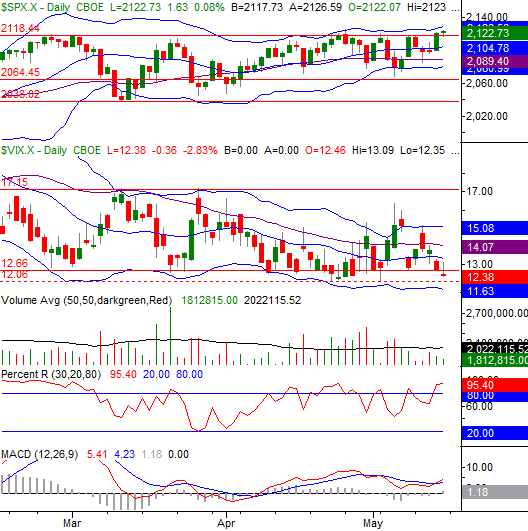
Chart created with TradeStation
The caveat to the bullish technical picture is that the market has pulled back or consolidated after making a new high or bull run several times since February -- even going back to July 2014 in the bigger picture, the market is higher since then but has seen multiple pullbacks and grinding sideways periods within that. The narrowing formation range seen since March should be concluded soon with a big move in one direction or the other, the trend indicators pointing to that it will be to the upside.
You can also see the CBOE Volatility Index (VIX) (VXX) broke under a big floor at 12.7. That's a potentially bullish step, but there's a last-ditch floor for the VIX at 12.1 we have to respect.
The NASDAQ Composite's (COMP) daily chart also cleared its comparable hurdle at 5046, though again, just barely. The NASDAQ's volatility index, the (VXN), also broke under a big floor at 14.1, which opens up a whole new realm of bullishness that hadn't been accessible before now. The question is, will the bulls actually use it now that the opportunity is within reach.
NASDAQ Composite & VXN - Daily Chart
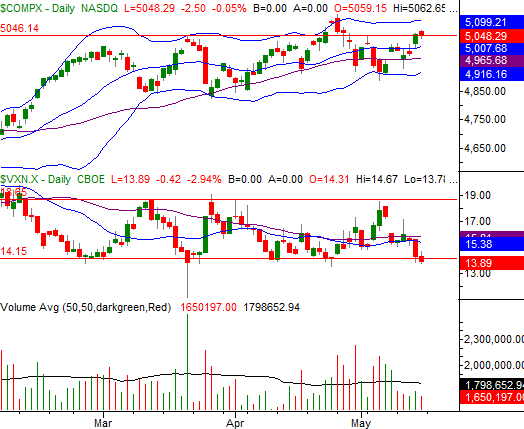
Chart created with TradeStation
The one shortcoming of both these daily charts is a lack of volume behind the breakout moves. If they were to be really compelling, we should be seeing more interest/participation in them.
It's possible the volume will start to perk up as investors solidify their belief in what they're seeing. Until we actually see more buying interest though, we'll keep any bullish outlook on a short least.
The weekly chart of the S&P 500 doesn't add anything to the discussion, but the weekly look at the NASDAQ does underscore the bullish argument. It's in this timeframe we can see the composite is still just traveling higher within a well-defined, rising set of support and resistance lines. There's room to keep rising before the upper edge of this zone (at 5125) is bumped into, and if the VXN can break under the floor at 13.8, doing so would get much easier. That small step is actually a very tough but very important step to that end, however.
NASDAQ Composite & VXN - Weekly Chart
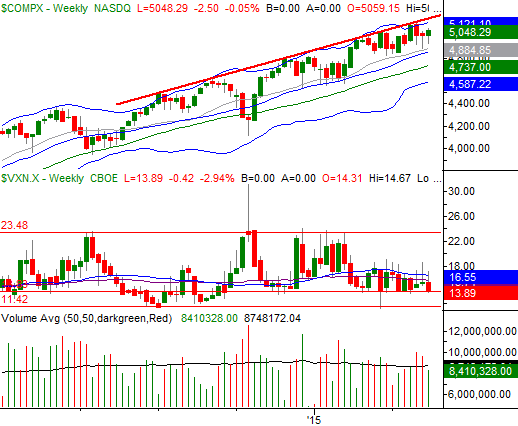
Chart created with TradeStation
Conversely, the composite can't be said to be in a downtrend until a key floor at 4854 is snapped.
With all of that being said, the fact that stocks are overdue for a correction isn't even the biggest potential risk right now. It's the calendar. The summertime can be a slow time for stocks, and occasionally quite bearish in the right circumstances. Between the potential profit-taking on the table and the fact that we've now started what's on average the lowest six months of the year, this rally should be watched carefully, and not blindly trusted (not that any shouldn't be). All the same, it's a rally, and we have to trade the trend until we clearly can't justify doing so any longer.
Trade Well,
Price Headley
BigTrends.com
1-800-244-8736