Where We Stand Now - Weekly Market Outlook
Even with Friday's bounce, the bulls couldn't do anywhere near enough to undo Wednesday's damage. All told, the S&P 500 (SPX) (SPY) lost 2.2% last week.
The results look grim, and several of our key technical indicators are at or near bearish conditions. The breakdown hasn't truly taken hold yet though, and we have to entertain the possibility that the bulls may well take charge again before any pullback is allowed to materialize.
We'll look at both sides of the coin below. The first thing we want to take care of is a run-down of last week's and this week's economic news.
Economic Data
It wasn't an especially busy week last week in terms of economic data, but much of the data we got was important information.
A couple of those important data nuggets were a glimpse of the housing market's strength. New home sales shot up to a multi-year high pace of 539,000, while existing home sales edged a little higher from 4.82 million to 4.88 million. Between the two, home sales broadly continue to improve.
Home Sales, Existing and New Chart
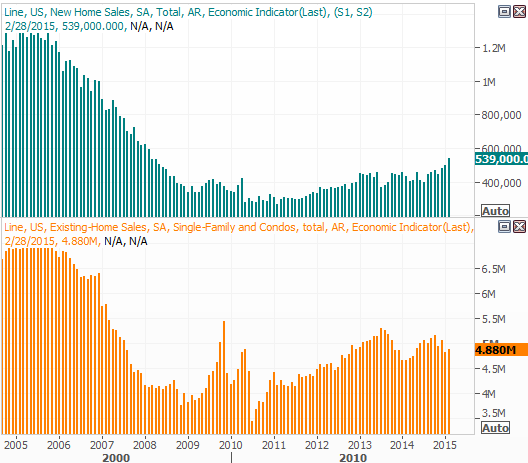
Source: Thomson Reuters Eikon
It was also an important week for the nation's inflation situation. With last month's 0.2% increase in consumer prices - with or without food and energy - translated into an annualized rate of 0.0%. We still need something closer to 2.0% (or at least some assurance inflation is headed there) before the Federal Reserve can truly seek to raise interest rates. Given this bigger-picture chart, it could be a while before that's decidedly going to happen.
It's worth pointing out that without the contraction in food and energy prices, inflation would be near an ideal 1.7%.
Inflation Trend Chart
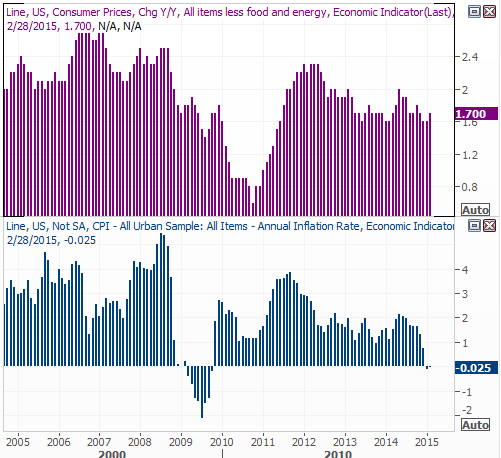
Source: Thomson Reuters Eikon
Durable orders fell in February, whether or not transportation orders are factored in. They were off 1.4% overall on a month-to-month basis, and fell 0.4% when only considering non-transportation orders.
While the dip seems alarming on the surface, truth be told, it's not unusual to see such lulls from one month to the next. More meaningful is the bigger trend of total orders expressed in dollars. That's the data presented on the chart below. Even when visually adjusting for seasonality, we can see last month's pullbacks took the totals to multi-year lows. That's something all investors need to keep in mind.
Manufacturers Orders Chart
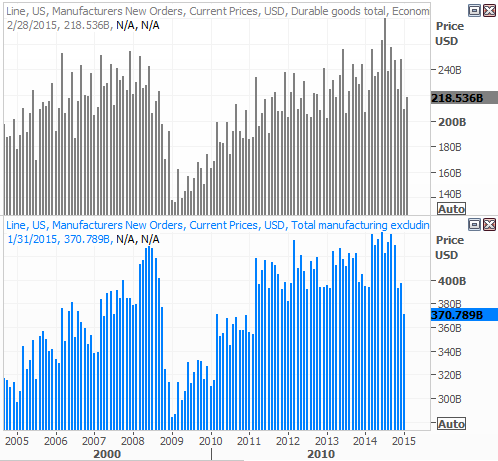
Source: Thomson Reuters Eikon
Everything else is on the following grid:
Economic Calendar
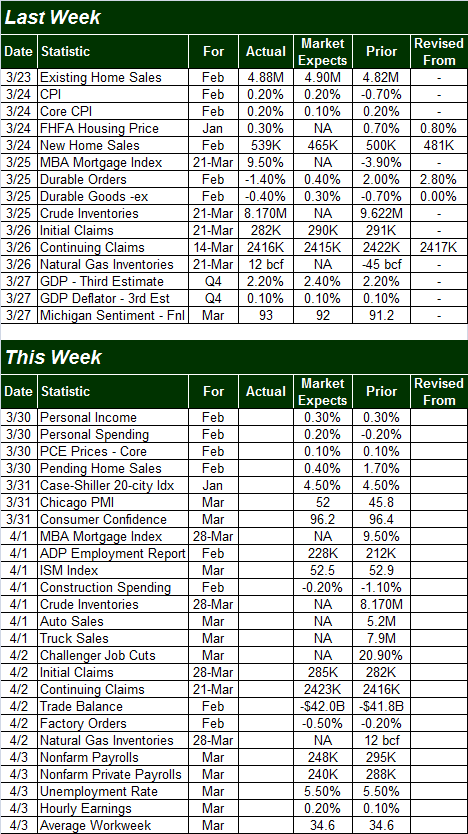
Source: Briefing.com
The coming week is going to be even busier. It's a pretty big week for more real estate and construction data, but the centerpiece of economic information on the way this week is Friday's unemployment snapshot. Economists don't expect any change in current the current unemployment rate of 5.5%, but these pros do foresee the creation of 248,000 new jobs.
Stock Market Index Analysis
Let's start with a look at the daily chart of the S&P 500, though know that it's the NASDAQ Composite (COMP) giving us some clearer clues.
The bearish news is, the S&P 500 broke under the 50-day moving average line (purple) on Wednesday, and in so doing, also broke below what used to be a key ceiling - and is now apt to become a floor - around 2065. Even with Friday's upswing, it looks as if 2065 is still actively trying to hold the bulls back. We can also see the MACD lines are showing us a bearish divergence, and both MACD lines are nearing a move below the zero level.
S&P 500 & VIX - Daily Chart
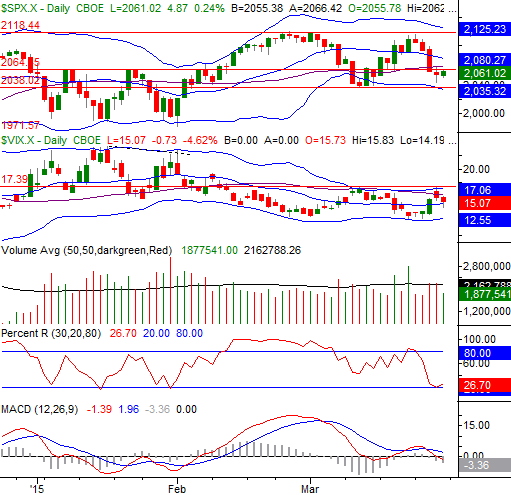
Chart created with TradeStation
There's still a bullish argument too, though. The CBOE Volatility Index (VIX) (VXX) is still finding a ceiling around 17.2, where it pealed three weeks ago and where its upper Bollinger band is now resting. Perhaps most important of all, though, is that the S&P 500 itself has managed to hold above 2038, which is the biggest line in the sand right now. A break under that level would mark the first lower low in a while, and could be what turns the tide for the worst. As was noted though, it hasn't happened yet.
At the same time, the S&P 500 could still crawl back above 2080 with relative ease, rekindling the uptrend and sidestepping any pullback.
While the chart of the S&P 500 may be tilted slightly bearishly, the NASDAQ Composite is tilted slightly bullishly. Specifically, not only is the NASDAQ still above its 50-day moving average line and lower Bollinger band, those lines appear to be the reason the bulls were able to begin work on a reversal on Thursday. It also appears the Nasdaq Volatility Index (VXN) has found a ceiling at 18.6; a falling VXN tends to coincide with a bullish market.
NASDAQ Composite & VXN - Daily Chart
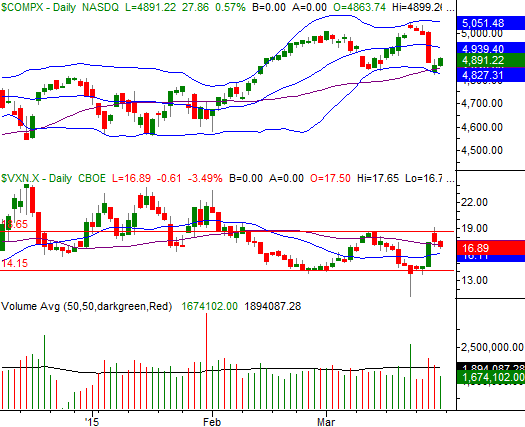
Chart created with TradeStation
The NASDAQ needs to move back above the 20-day moving average line at 4939 to really move back into a bullish mode. The flipside is, of course, the composite is still just one bad day away from breaking under a major floor around 4826.
Mixed message? You bet. And zooming out to a weekly chart of the S&P 500 doesn't change the message one bit. It's in this timeframe we can plainly see the index is contending with a ceiling around 2119, yet is also likely going to be supported by the 26-week moving average line at 2039. It's been a major floor since 2013, reversing all but one of the lulls between then and now.
S&P 500 & VIX - Weekly Chart
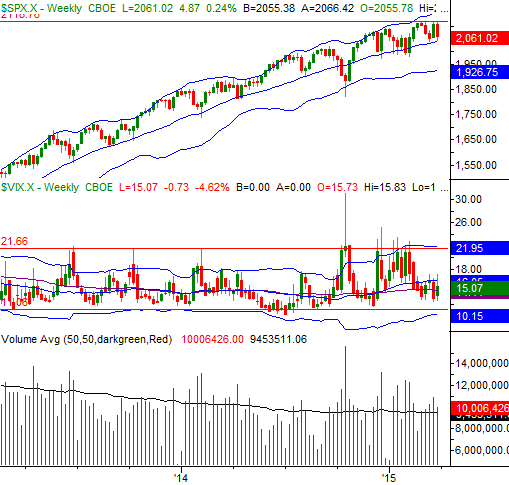
Chart created with TradeStation
While there may not be a strong "trend" to trade right now, the good news is, the lines that will mark a further breakdown or a rebound are pretty clear.
U.S. Dollar
While the future of the U.S. Dollar (UUP) is still in question, for what it's worth, the pullback over the course of the last two weeks is the most damaging dip the greenback has suffered in months. Though the U.S. Dollar has been below its 20-day moving average line (blue) a few times since this monster-sized rally began in July, it fell well under it this time around. And, when the dollar started to rally on Friday, all it took was a brush of the 20-day line to start the pullback.
U.S. Dollar Index Chart
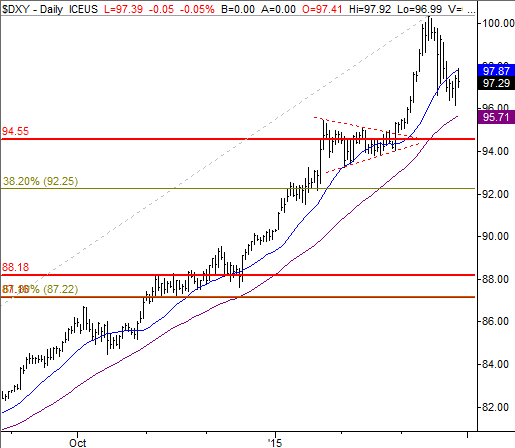
Chart created with TradeStation
Caution is advised when applying technical analysis to currency currently, as there's more in play with currency values than historical tendencies and psychological patterns. To the extent they matter though, the U.S. Dollar is on the defensive now. Another lower low (under Thursday's low of 96.17) could rekindle some bearish problems for the dollar. To that end, the horizontal lines on the above chart are key support and resistance levels for the index, and/or Fibonacci lines. If the dollar's current weakness continues to develop, those levels are the most likely spots where the bulls will try to regroup.
Trade Well,
Price Headley
BigTrends.com
1-800-2449736