When (and Why) to Use a Bull Put Spread - Our "Real Trade" Example From the Index Options Timer Service
This week, our Index Options Timer service locked in a nice gain on an option trade. While there's something to be learned with any trade, this particular position - a credit spread on the SPDR S&P 500 ETF Trust (SPY) - was an especially noteworthy sample worth reviewing, as it readily demonstrated several key elements of good trading.... trade selection, chart analysis, and timing. A closer look is merited.
As is ultimately the case with all trades, the crux of this trade largely depends on being right about the near-term future of a chart, or at least not being wrong. By that, we just mean there are some strategies that don't necessarily require a stock or index to move in an advantageous direction. Sideways movement will do.
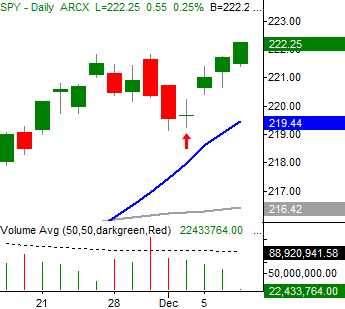
And that's largely what was seen on Friday, December 2nd (marked by the arrow). We saw what looked like a pullback from the SPDR S&P 500 ETF Trust that had run its course, leaving the ETF ripe for a near-term bounce. If nothing else, the selling appeared as if it were ready to abate.
Were there absolute certainty a bullish rebound was in the making, the right move to make would have been purchasing a call option -- an instrument that gains in value when the underlying stock or index rises -- and calling it a day. In this particular case though, while the odds of a bounce were strong, there was still a bit of a downside chance of SPY moving lower. So, to reduce some of that risk, a bull put spread (or credit put spread) was utilized.
While puts are normally used to make bearish bets - since they gain in value as the underlying instrument loses value - selling or "writing" a put can in many ways be the equivalent to buying a call. Selling puts outright can be a bit of a risky venture though, so to mitigate our risk, we not only sold or wrote a put, we bought a cheaper put just to use as something of an insurance policy. In this particular trade, our goal wasn't to reap a gain on any bullish move made by SPY. Instead, our goal was to keep the difference between what we paid for one put and what we pocketed by selling the other put.
The trade's specifics will illustrate the idea. On December 2nd, we issued these instructions to Index Options Timer subscribers:
STO the SPY December Week 2 (12/09) 218 Put (SPY 161209P218)
And
SIMULTANEOUSLY
BTO the SPY December Week 2 (12/09) 217 Put (SPY 161209P217)
for a net Credit of 0.20 or better.
"BTO" means buy to open, and "STO" means sell to open; the trade is reversed by "buy to close" and "sell to close" orders. The credit just means that for every pair of 217 and 218 puts, we put $20 in our pocket. ($0.20 times 100 shares per contract). This was possible because the purchase of the 217 put was considerably cheaper than the price of the 218 put at the time. (That's because the 218 put was almost in-the-money, while the 217 put was, at the time, essentially worthless.)
If SPY were to bounce, both the 217 and 218 puts would expire worthless just a little over a week later... at the end of the second week of the month.
If instead the SPDR S&P 500 ETF Trust just drifted sideways above 218, well, that would be ok too. Remember, the trade is only a liability if SPY is below 218, since someone could exercise the 218 puts against us. Even if that were to happen though, we've still got the $20 per contract credit to help offset any of that loss.
The worst case scenario here would be a loss of $0.80, or $80 per contract, and that would only be realized if SPDR S&P 500 ETF Trust were to break to or below $217. At that point we could sell or exercise the 217 put we owned, and use that to offset any loss booked when we were forced to cover the short trade on the 218 put. The difference between the two strikes represents the maximum liability of the trade -- $1.00, or $100 per contract -- but remember, we've already put $20 per contract in our pocket.
To that end, while a risk/reward ratio of $100/$20 seems a little backwards, it's not. These bull put spreads work because the puts involved are very near-term puts. In this case, they were set to expire just a little over a week lower. Time decay, or theta, is very significant by that point in an option's life, so each passing day that SPY held above $218 means the two put options were increasingly worthless.... what we wanted. Plus, with only a few days to do anything, it was unlikely an index-based ETF like SPY was capable of making a significant move; indices don't move all that fast.
And sure enough, the whole thing worked out perfectly. On December 6th we issued these instructions to Index Options Timer members:
BTC the SPY December Week 2 (12/09) 218 Put (SPY 161209P218)
And
SIMULTANEOUSLY
STC the SPY December Week 2 (12/09) 217 Put (SPY 161209P217)
for a net Debit of 0.05 or better.
The debit simply meant we paid $5.00 per every pair of 217/218 puts we exited that we had entered just a week earlier. Subtracting that $5.00 exit cost from the $20.00 credit we booked upon entering the trade, we netted a profit of $15.00 per pair.
It's not a lot, but when you're talking about 10 or 20 or even 100 contracts, you're talking about $150, $300, or even $1500 dollars worth of profit, respectively. And, it doesn't take a whole lot of capital to make credit spread trades. Much less capital is tied up with spreads than there is with straight-up purchases of put or call options anyway, and in this case, there was much less risk with the spread than an outright purchase of a call option would have posed.
With all of that being said, the key to this trade's success was still making the right decision about where a chart is headed. Though there were several reasons we had to suspect a bounce was looming came in the shape of the chart itself, there was one in particular.
Long story made short, even by the middle of the day on the 2nd it was becoming clear that day's bar was going to be a doji bar, where the open and close are both right in the middle of the high/low range. These shapes often indicate a transition from one trend to another. Confirming the ideas that the sellers weren't serious at the time was the fact that there wasn't a lot of volume behind the prior day's weakness.
Still, while there are instances where an straight-up buy of a put option or call option makes the most sense, this wasn't one of them; we had to play a little defense even though the upside potential was significant.
It may all be a little intimidating to walk through at first, but it's not. A couple of "hypothetical paper trades" can make sense of bull put spreads, or credit put spreads, in fairly short order. Or, if you'd just rather have someone do all the analysis and planning for you, the Index Options Timer is one of our popular newsletters simply because it's so easy to implement with the clear-cut instructions you saw above.
To subscribe to our Index Options Timer service, go here.