What is the Relationship of VIX Levels and Volume Trends?
What Is the Relationship of VIX Levels and Volume Trends?
At the annual FIA Expo conference in Chicago last week, there was quite a bit of discussion about the topics of products' option trading volume trends and the recent levels of the CBOE Volatility Index (VIX) (VXX).
The average daily closing values for the VIX Index were 32.7 in 2008, 24.2 in 2011, and 17.9 year-to-date in 2012.
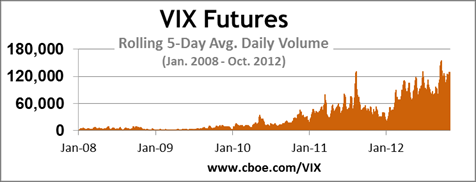
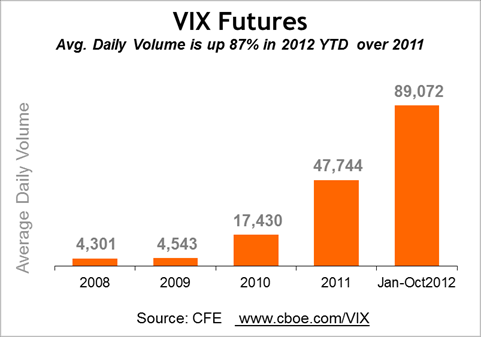
While trading volumes so far in 2012 are down in many stock, futures, and options markets, an all-time record 2,443,878 VIX futures contracts changed hands in October 2012, beating the September record of 2,400,552 contracts. The average daily closing value for the VIX spot index in October 2012 was 16.28 (well below the 20.5 all-time average daily closing value of the VIX dating back to 1990).
COMPARE FIVE CHARTS FOR THE SAME TIME PERIOD
Below are five charts that cover the same time period.
CBOE Volatility Index (VIX)-- Daily Closing Values (Jan. 2008 - Oct. 2012)
 Note the peaks and valleys of VIX price chart above, and compare them to the peaks and valleys in the four volume charts below.
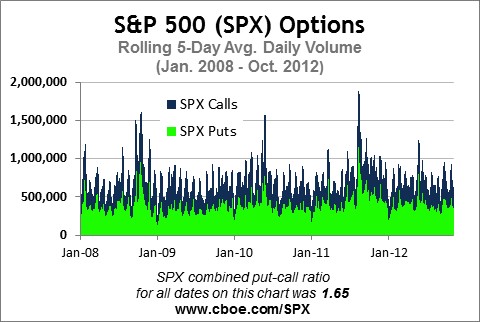
S&P 500 (SPX) Options - Rolling 5-Day Average Daily Volume (ADV) (Jan. 2008 - Oct. 2012)
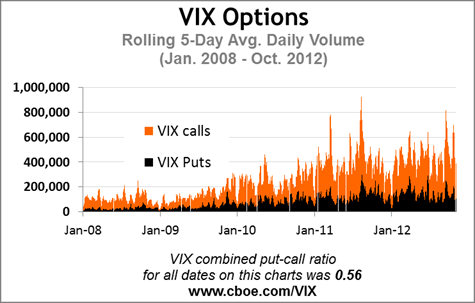
 VIX Options - Rolling 5-Day A.D.V. (Jan. 2008 - Oct. 2012)
 VIX Futures - Rolling 5-Day A.D.V. (Jan. 2008 - Oct. 2012)
 VIX Futures - Annual A.D.V. (Jan. 2008 - Oct. 2012)
 ARE HIGH OR LOW VIX LEVELS RELATED TO HIGHER INDEX OPTIONS VOLUMES?
Upon viewing the 5 charts above, it does appear that the some of the peaks for the VIX prices and the volume peaks (particularly for SPX options) are interrelated.
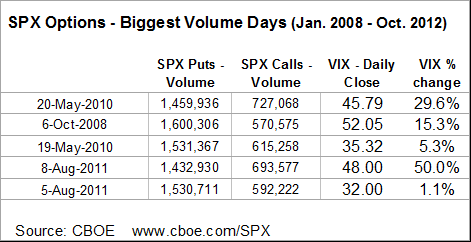
Here is an example of interrelationships - in early August 2011 the credit rating of U.S. Treasury debt was downgraded, and on August 8, 2011, the VIX Index shot up by 50%, and S&P 500 (SPX) (SPY) options had one of their top volume days ever, with more than 1.4 million SPX puts and 693,000 SPX calls (see table below). The increase in volume for August 2011 over July 2011 was 66% for SPX options and 9% for VIX options. Interest in protective strategies often has increased at times when volatility and VIX have big rises.
Biggest SPX Options Volume Days Chart
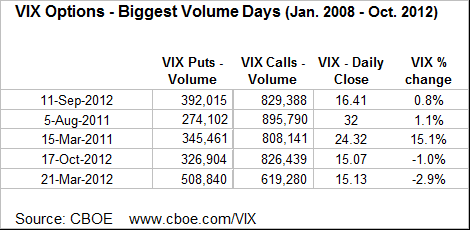
 On the other hand, both the VIX futures and VIX options experienced all-time record volume days in the past two months, despite the fact that the VIX Index has closed below 20 on every trading day since June.
Biggest VIX Options Volume Days Chart
 Many investors are interested in using VIX and SPX products when they can be less expensive portfolio diversification tools at times when the VIX is at relatively low levels. SPX and VIX products can be valuable option trading tools in times when volatility is high or low.
Investors who are bullish on VIX, and bearish on stocks might consider strategies such as -
Long VIX Call Options, Long VIX Call Spreads, Short VIX Put Credit Spreads, Long VIX Futures, and SPX protective puts and collars.
Courtesy of Matt Moran, cboe.com
